This repository contains the code and resources for the Surface Thermal Temperature Prediction project, which focuses on predicting surface temperatures using thermal images. The project leverages image processing techniques, machine learning (specifically LSTM), and temperature scaling to achieve its objectives.
- Introduction
- Project Workflow
- Getting Started
- Code Structure
- Data
- Usage
- Results
- Screenshots
- Contributing
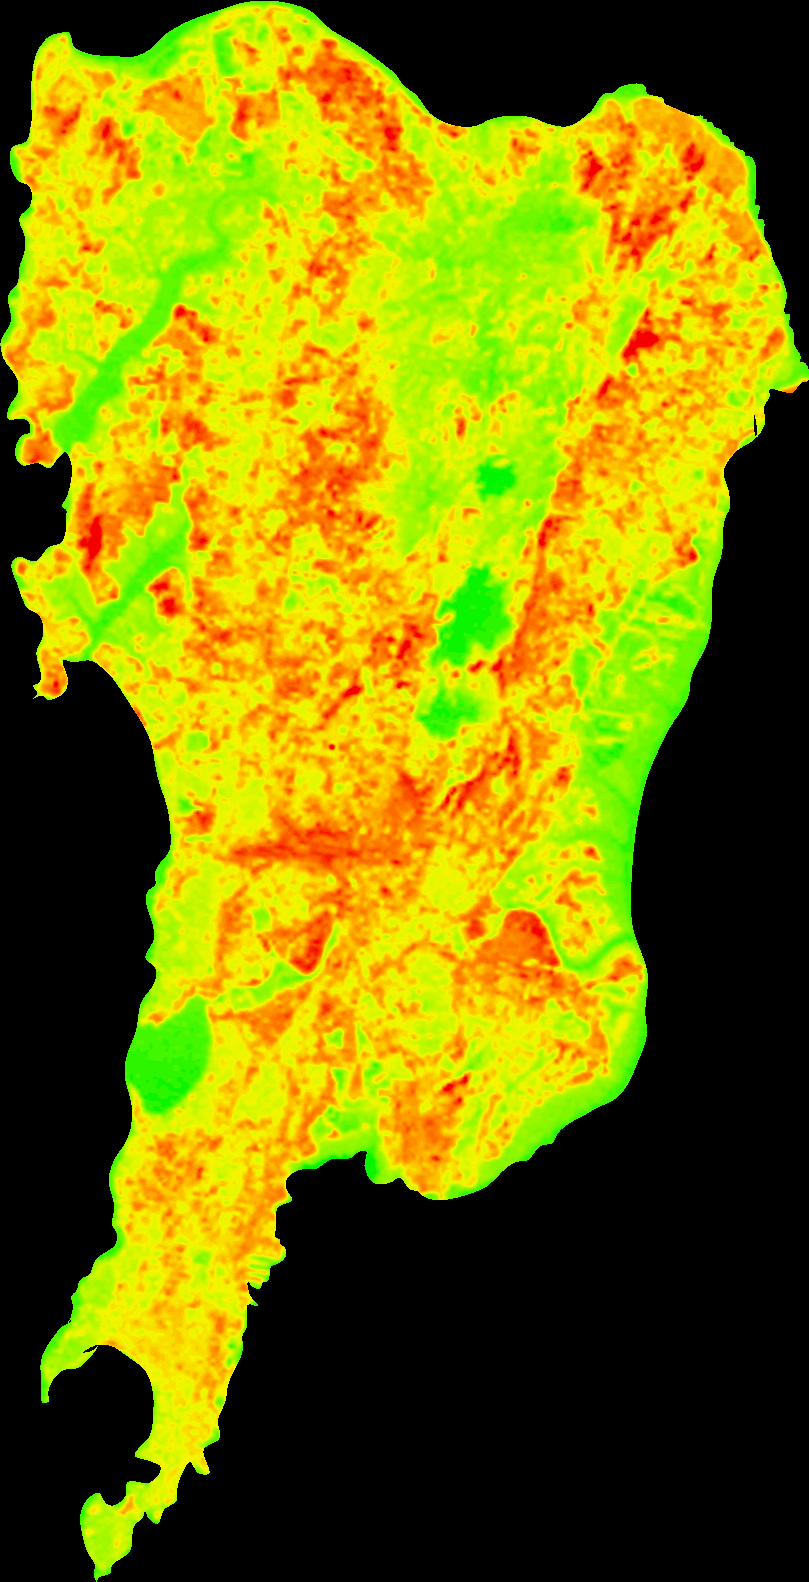
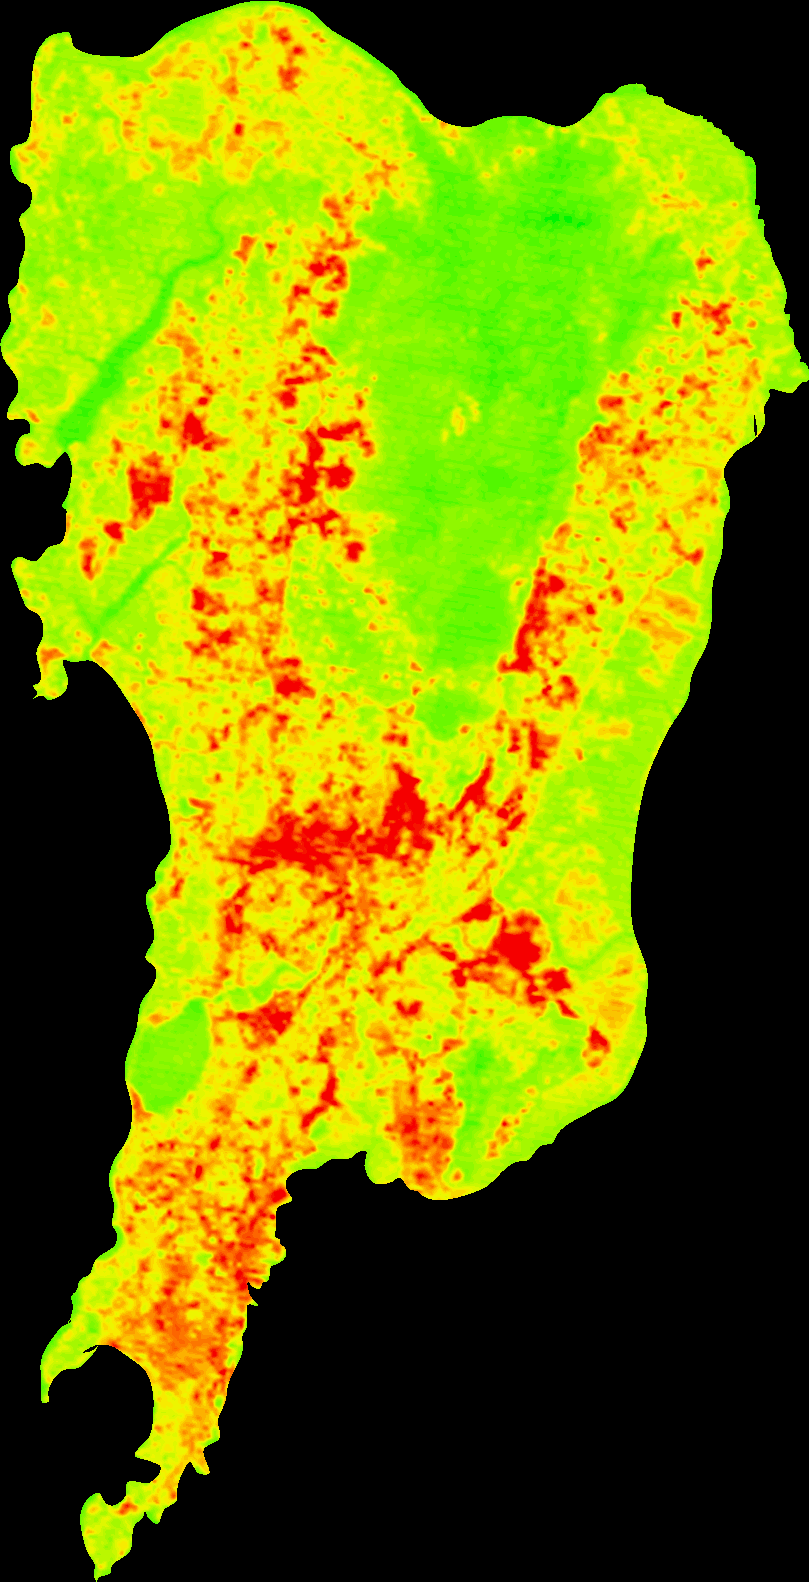
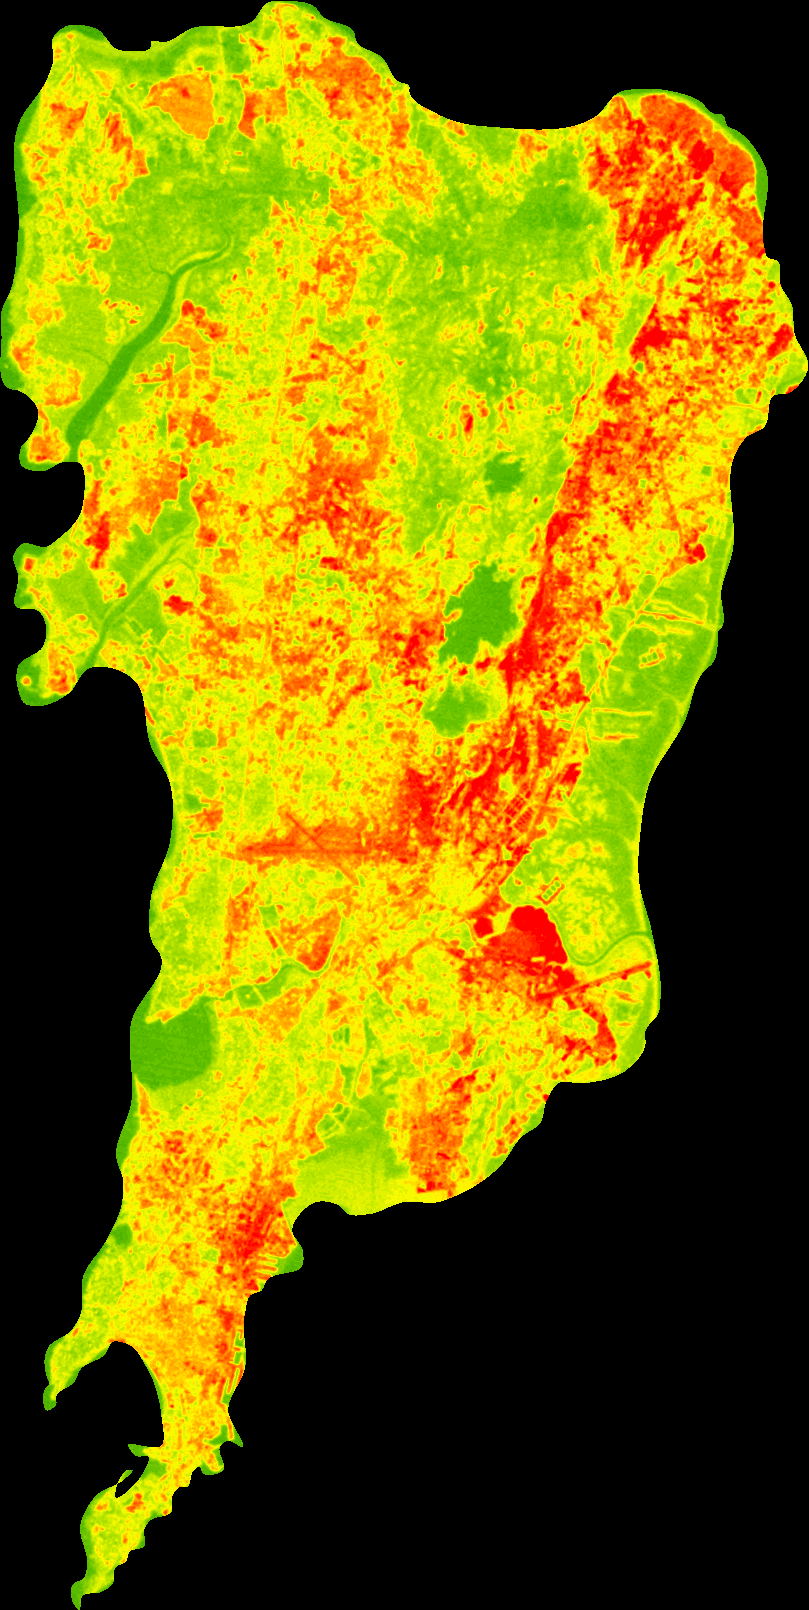
The Surface Thermal Temperature Prediction project aims to predict surface temperatures using thermal images of the Mumbai map. This involves a multi-step process including image processing, data extraction, temperature scaling, machine learning training (using LSTM), and image reconstruction. The images is obtained from Landsat 8 from USGS EarthExplorer.
- Input: Thermal images of the Mumbai map in .bmp format.
- Image Processing: The OpenCV library is used to process the images, extracting RGB values of each pixel.
- Data Preparation: A custom temperature scale is created for data scaling.
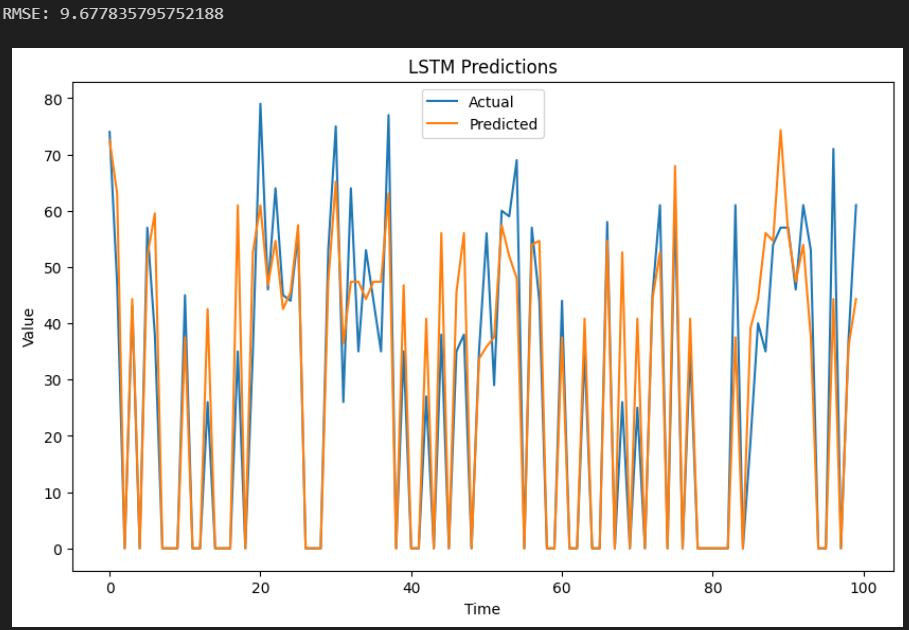
- Machine Learning: LSTM (Long Short-Term Memory) algorithm is employed to train the model. Temperature values are used as inputs, and the model predicts temperatures as outputs.
- Image Reconstruction: The output temperature values are utilized to reconstruct the thermal image of the Mumbai map for the year 2030.
To get started with the project, follow these steps:
- Clone the repository:
git clone https://github.com/aniketparate/Surface-Thermal-Temp-Prediction.git
- Install the required dependencies mentioned in
requirements.txt.
The project's code is organized as follows:
final.ipynb: This Jupyter Notebook contains the main implementation of the LSTM algorithm along with the reconstruction algorithm.code/: This directory contains separate.pyfiles for individual tasks, which are combined infinal.ipynb.data/: This directory contains the generated CSV file and input thermal images.
The data/ directory contains the resources used in the project:
original/: The sub-directory holds the csv files containing the extracted RGB values and input images.
- Follow the instructions in
final.ipynbto run the LSTM algorithm and the reconstruction process. - You can modify parameters, model architecture, or other settings as needed.
The project's main output is the predicted surface thermal temperature of the Mumbai map for the year 2030. The reconstructed image will provide a visual representation of these predicted temperatures.
Input image
| 2000 Feb | 2010 Oct | 2020 Feb |
|---|---|---|
 |
 |
 |
Output image
| 2030 |
|---|
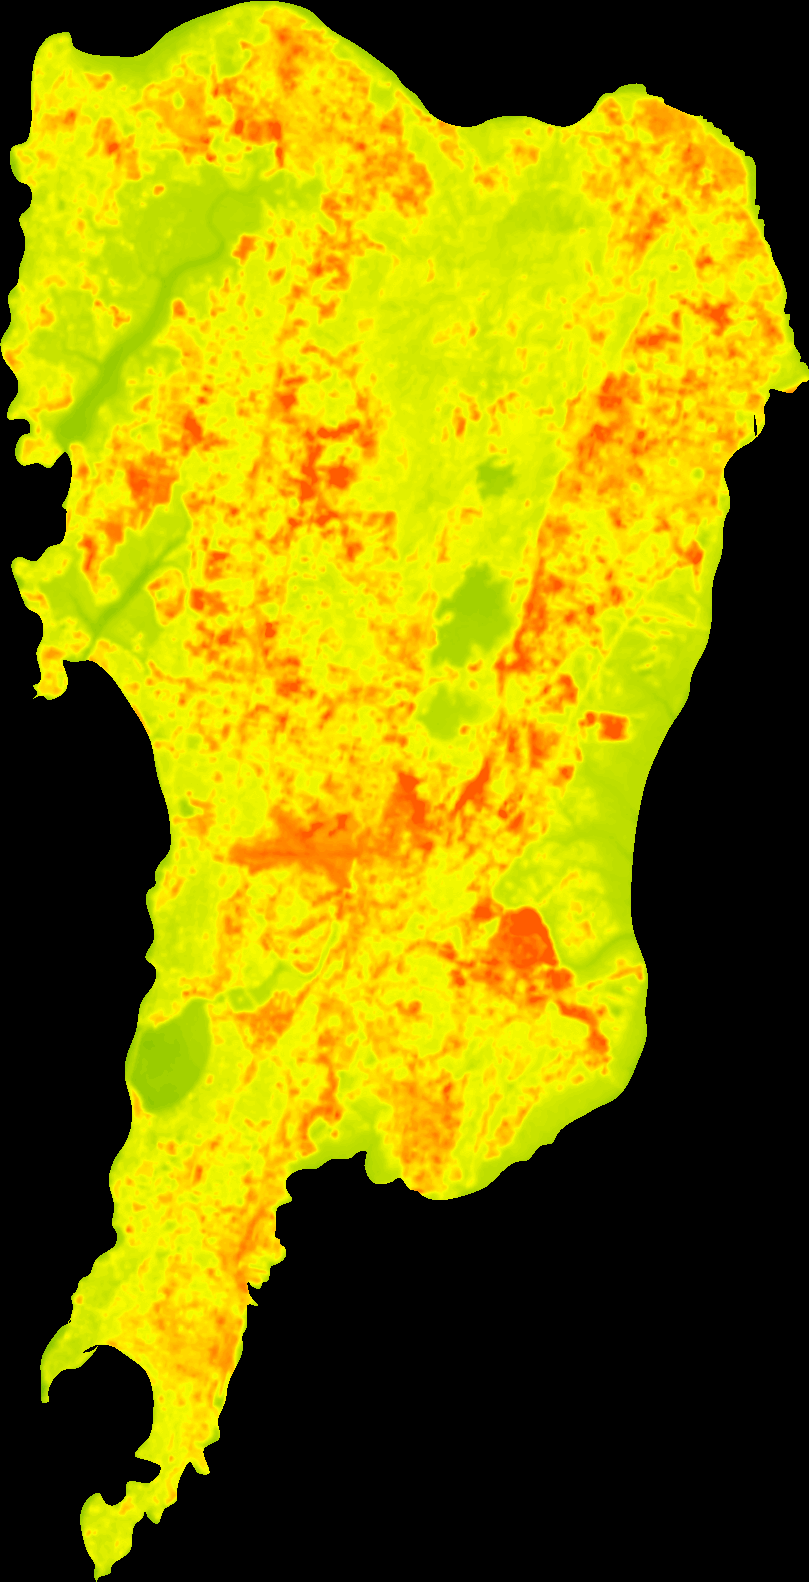 |
Contributions to the project are welcome! If you'd like to contribute, please follow the standard GitHub workflow of forking the repository and creating a pull request.
