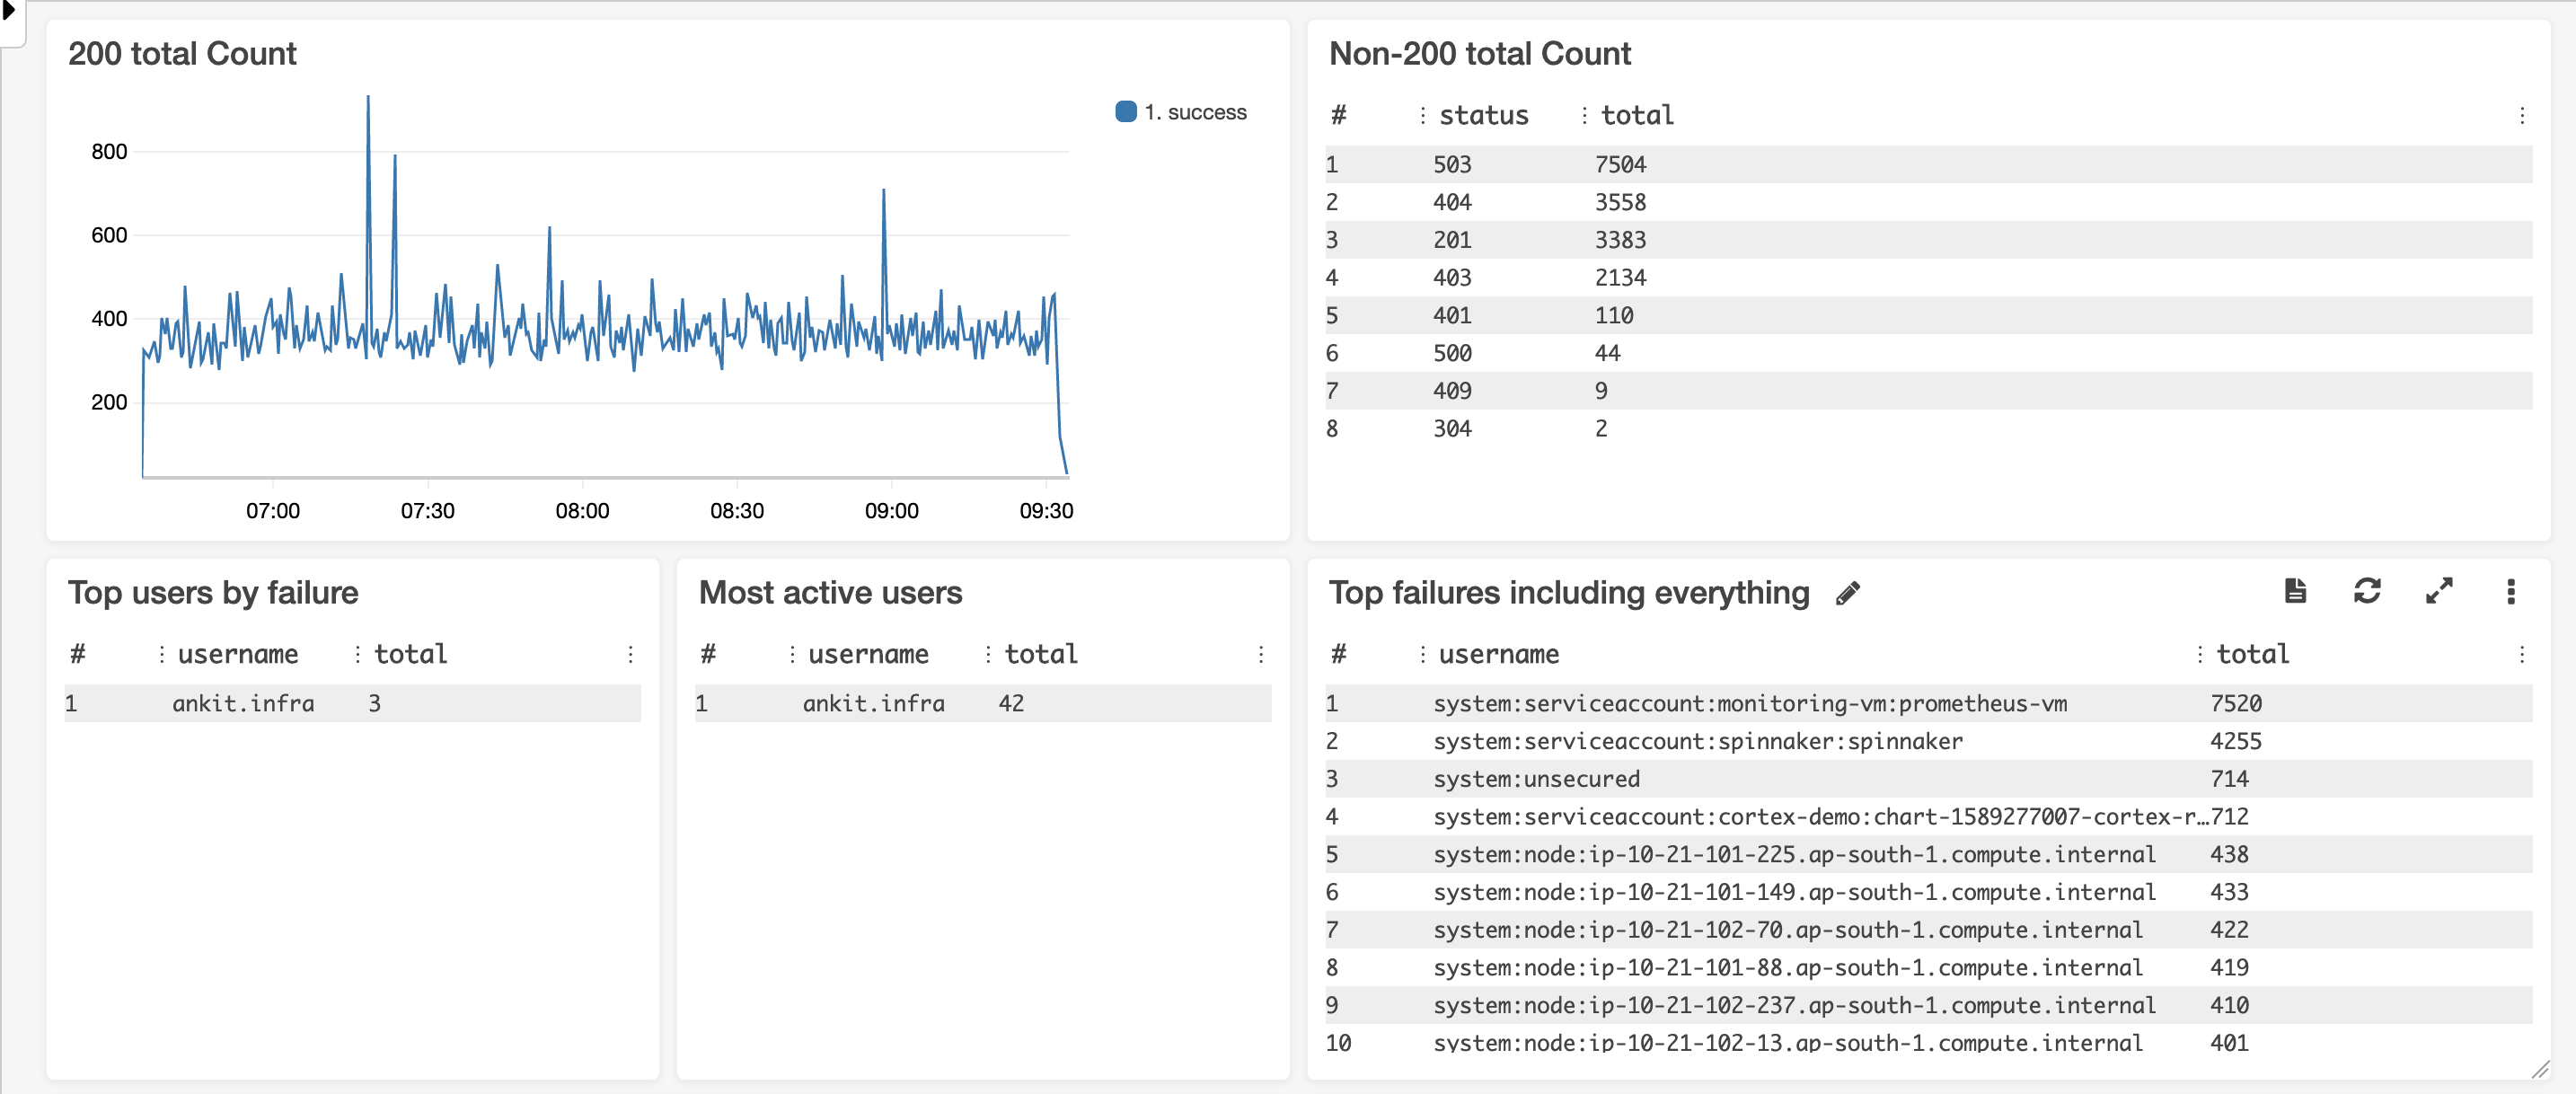
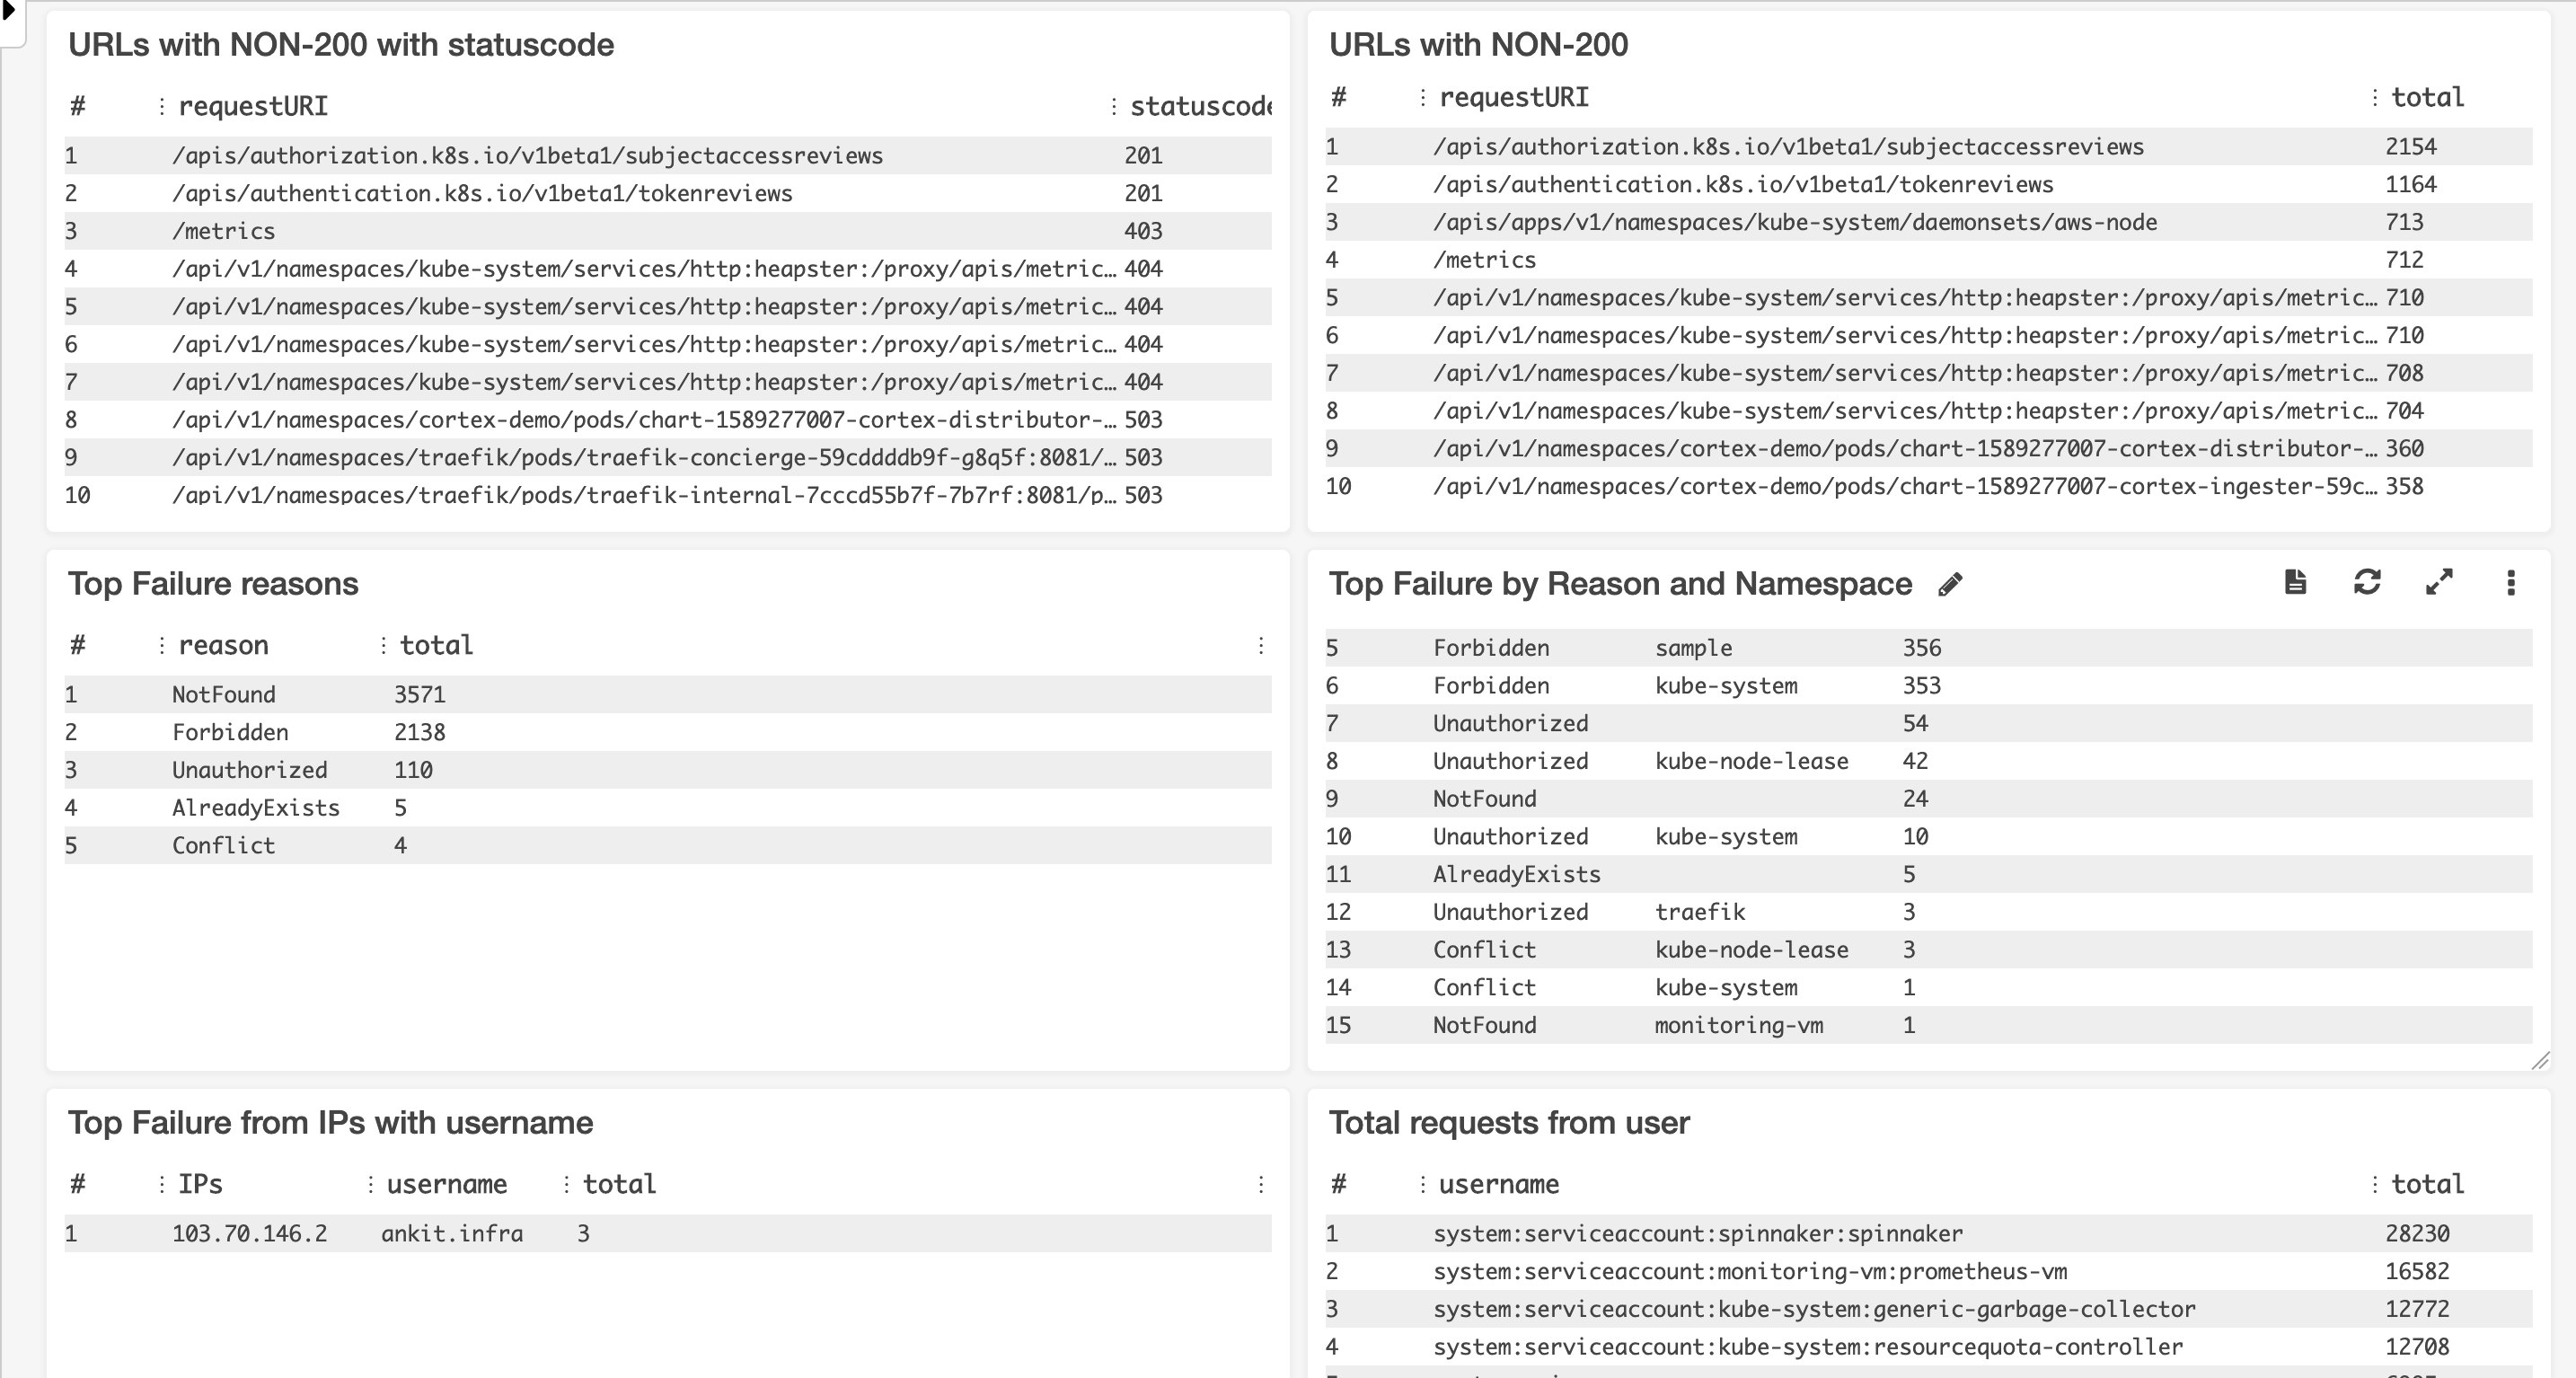
In EKS, we have 5 major components that are supported for logging and logs are being pushed to CloudWatch if enabled.
Those Components include:
- Apiserver Logs
- Audit Logs
- Authenticator Logs
- Controller manager Logs
- Scheduler Logs
As of now, we have added only cloudwatch dashboard for Audit Logs, it will look like this--
To setup the EKS Audit logs dashboard, follow the setups:
-
Download the
audit-logs-dashboard.jsonfile.wget https://raw.githubusercontent.com/ankitjain28may/eks-cloudwatch-dashboard/master/audit-logs-dashboard.json
-
Find the source from the cloudwatch log group for eks and replace the
CLOUDWATCH_SOURCEwith the log group.sed -i "s/CLOUDWATCH_SOURCE/<cloudwatch-log-group-for-eks>/g" audit-logs-dashboard.json -
Create a new dashboard in cloudwatch and give it appropriate name.
-
Import the updated
audit-logs-dashboard.jsonas source to the above created dashboard.
Feel free to contribute
Copyright (c) 2020 Ankit Jain - Released under the MIT License

