This repository has server code to run the admin portal, collect and save the temperature/humidity data to the database and search index for plotting on graphs and to send out notifications based on certain business rules configured in the admin portal.
The devices that are sending the data are Raspberry Pi Units which are configured using instructions found in this repository. Currently Raspberry Pis configured with those instructions have been placed in the public school of Maplewood and are reporting temperature data to to a website running this code.
- Any Linux based server, such as Debian or Ubuntu
- Ruby 2.4.0 and Rails version 5 and nodejs version 4 or higher
- mysql
- Elasticsearch and Kibana
bundlerake db:createrake db:migraterake db:seedrails s
Deployments happen through Capistrano. Before you deploy make sure to point to the hostname of your server by updating this file
Once you have pointed the script to you server you can deploy using the bundle exec cap staging deploy command.
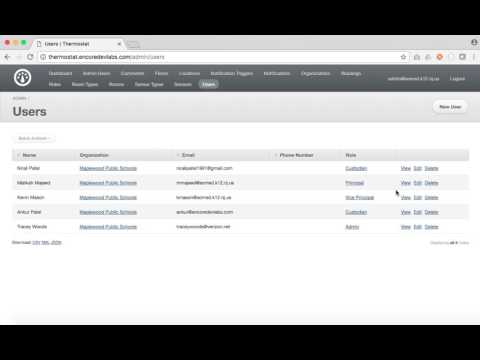
The site has an admin portal to configure
- Users (ie. Ankur or other users who will receive alerts)
- Organizations (ie. Maplewood Public School or SOMSD)
- Locations (ie. Tuscan Elementary School)
- Rooms (ie. Room 201)
- Sensors (ie. Raspberry Pi 3 which is sending the data)
- Roles (ie. Custodian, Admin, etc. who have preference to receive alert for the location, school, they belong to)
- Notification Trigger (ie. Trigger alert when temperature in this school goes above 85 degrees or trigger alert when temperature goes below a certain temperature)
The server only accepts readings from devices which are registered. This is a security measure so no one can post bogus readings or corrupt the data.
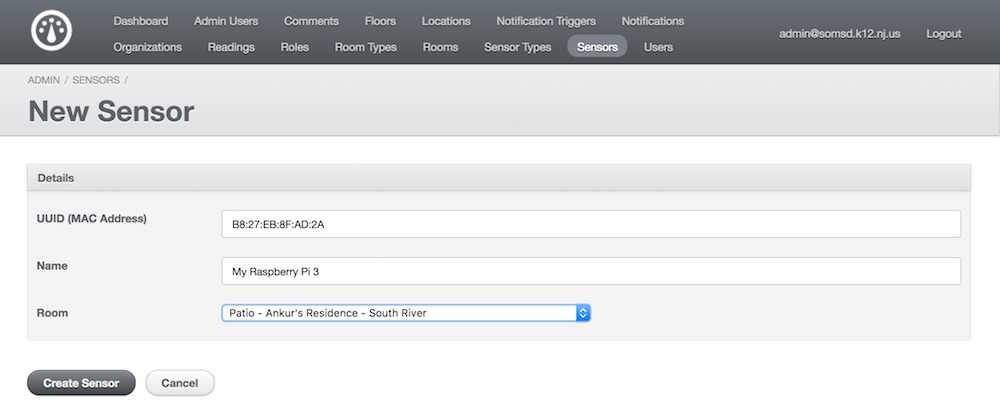
Device can be registered by going to /admin/sensors/new and by filling in the device's Wifi MAC address, along with a name/description to identity it and a Room it will be in. Once the device is added, the server will immediately start saving the readings from the device and you can view the data in the Metrics Dashboard and can set alert notification rules so you are notified when temperature reported goes above or below a certain limit.
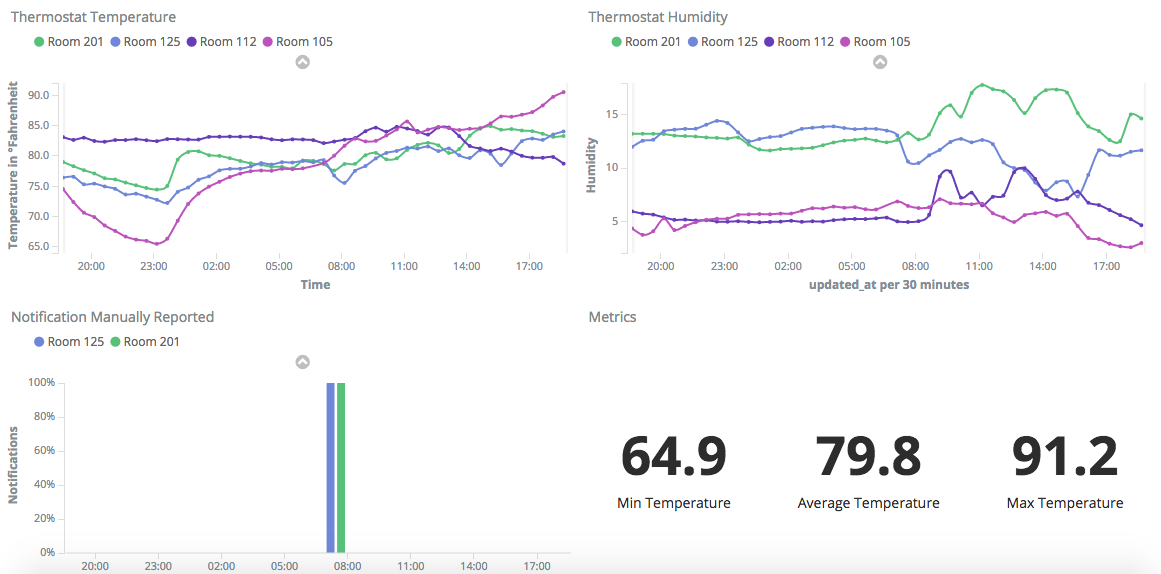
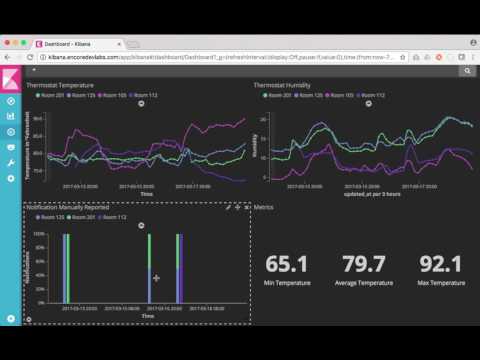
To view metrics, Kibana is used where it plots the data collected can one can make different types of charts/graphs to be viewed. It also support Auto Refresh so the site can be run on a screen or Kiosk to view the temperature/humidity data as they come in from the rooms configured.


