![]()
vdb - visual debugger
vdb is a C++ library that lets you easily create interactive 2D/3D visualization breakpoints. It can be used for things like:
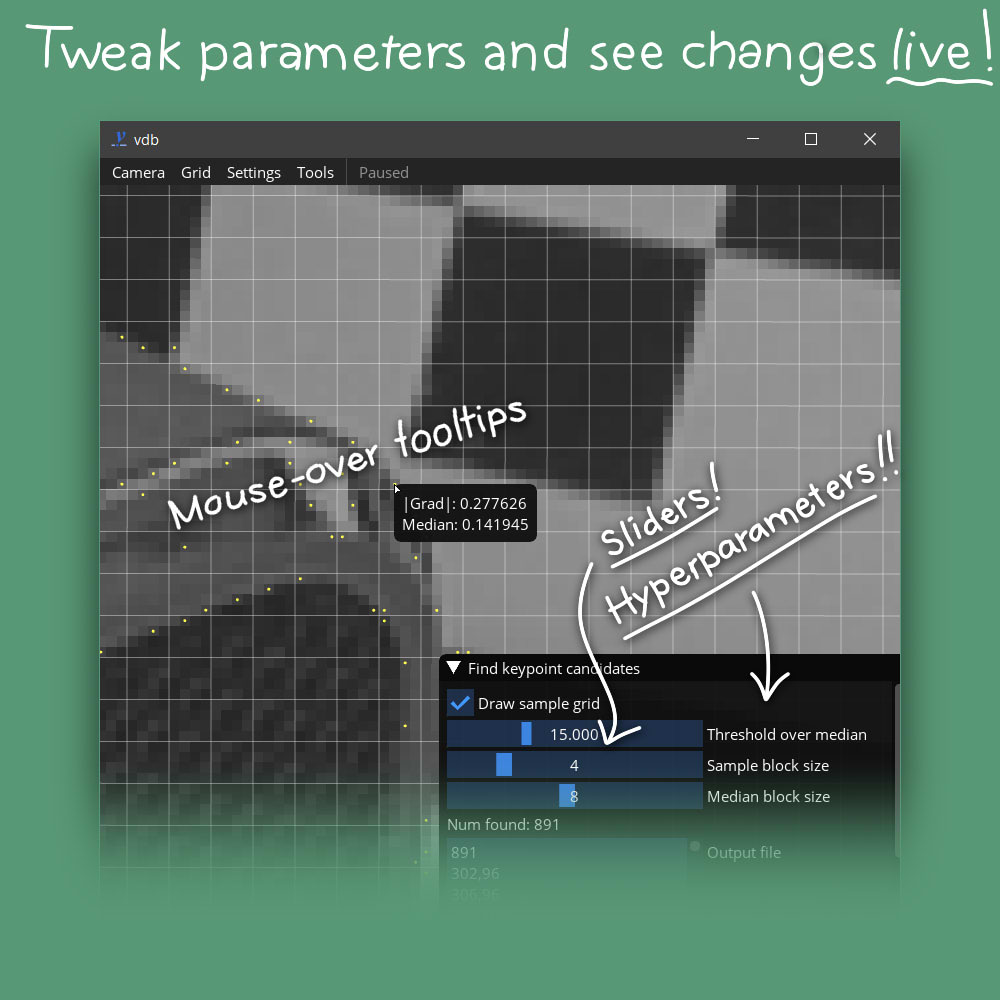
- Analyzing intermediate results in steps of an algorithm
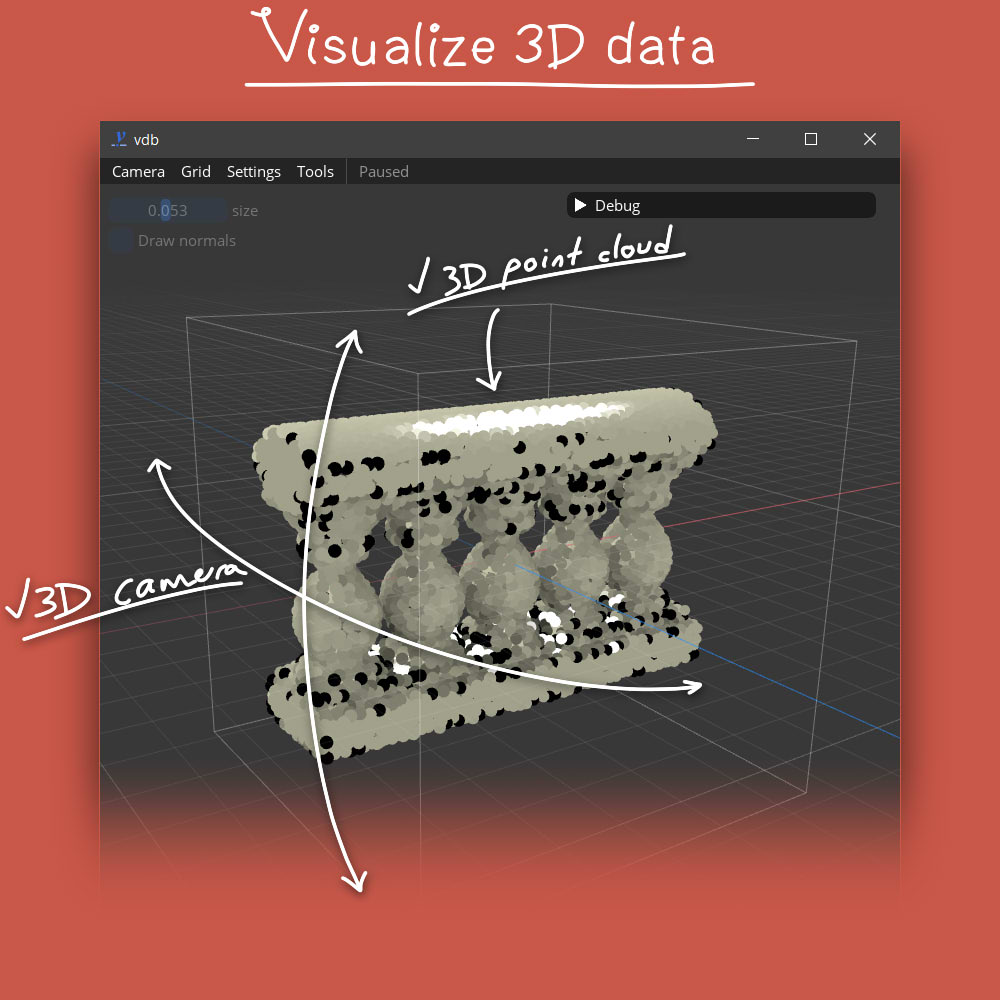
- Visualizing and pre-processing 2D and 3D input data
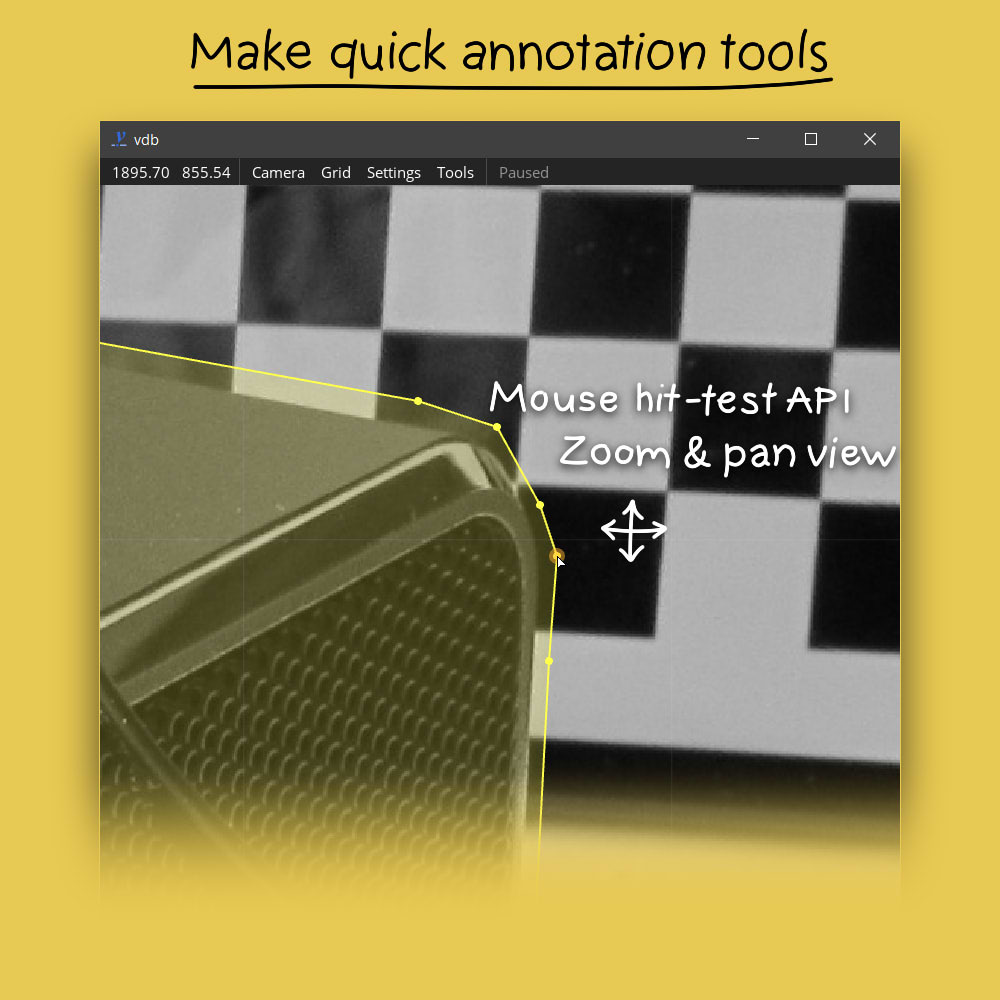
- Prototyping a GUI application for annotating data
vdb runs on Windows, Linux and Mac OS, and requires only an OpenGL 3.1 compatible GPU (which even really old laptops have).

Basic example
vdb works like a breakpoint debugger:
- you set breakpoints in your code by declaring named "blocks".
- your visualization code goes inside the block.
- inside the block you can access variables from outside.
For example, here's a program that opens a window and clears the background color to red using data outside the breakpoint block.
#include <vdb.h>
int main(int, char**) {
    float color[3] = { 1.0f, 0.3f, 0.1f };

    VDBB("Test window");
    vdbClear(color[0], color[1], color[2], 1.0f);
    VDBE();

    return 0;
}
This program only has one breakpoint, but your program can have many. As with a normal debugger, you can resume control flow and step to the next breakpoint.
Quick start
For a quick start, compile and run test/test.cpp by following the instructions inside the file. This is a self-contained program that uses the library to show off basic usage patterns.
Using vdb in your project
Once you are able to compile and run test/test.cpp you should be good to go integrate the library into your own project! Here are some tips to get you further:
-
Use test/Makefile or test/build.bat to build vdb in with your application
-
Learn to use vdb by running the interactive guide test/test.cpp and following along in the source code.
-
Learn to use Dear ImGui by visiting its project page.
Using vdb in other languages
vdb is currently a C++ library, but it should be possible to create bindings to other languages (such as Python). If anyone would like to assist with this I would gladly accept pull requests.