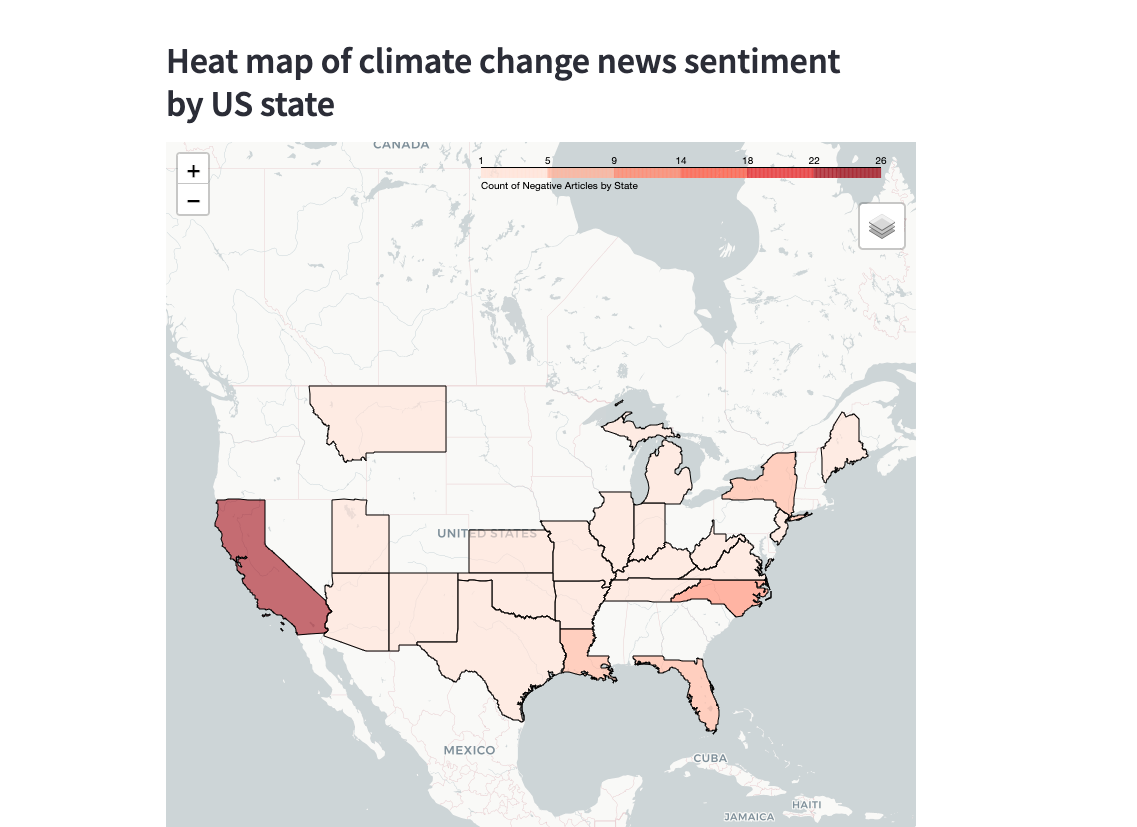
This project was built by Annie, Thienthanh, and Sarah for the WiD 2023 Datathon. The Climate Risk Viewer is a tool built by the Forest Service to spacially identify climate-related risks. Our Streamlit-based application is an innovative take on the Climate Risk Viewer that maps climate risk by identifying climate change related news articles by geographic location. In the application, a heatmap shows the quantity of climate change related articles with a negative sentiment. This tool allows users to view climate-related disasters and vulnerabilities using real-time news data.
Explore the docs »
View Demo
·
Request Feature
Table of Contents
git clone https://github.com/annieco/wid_climate_change_datathon
https://www.anaconda.com/distribution/
cd wid_climate_change_datathon
conda env create
wait for the environment to create.
conda activate wid_datathon_2023
conda activate wid_datathon_2023
Check that your prompt changed to
(wid_datathon_2023) $
jupyter notebook
streamlit run app.py
You are good to go! Enjoy!
Contributions are what make the open source community such an amazing place to learn, inspire, and create. Any contributions you make are greatly appreciated.
If you have a suggestion that would make this better, please fork the repo and create a pull request. You can also simply open an issue with the tag "enhancement". Don't forget to give the project a star! Thanks again!
- Fork the Project
- Create your Feature Branch (
git checkout -b feature/AmazingFeature) - Commit your Changes (
git commit -m 'Add some AmazingFeature') - Push to the Branch (
git push origin feature/AmazingFeature) - Open a Pull Request
Distributed under the MIT License. See LICENSE.txt for more information.
Project Link: https://github.com/annieco29/wid_climate_change_datathon