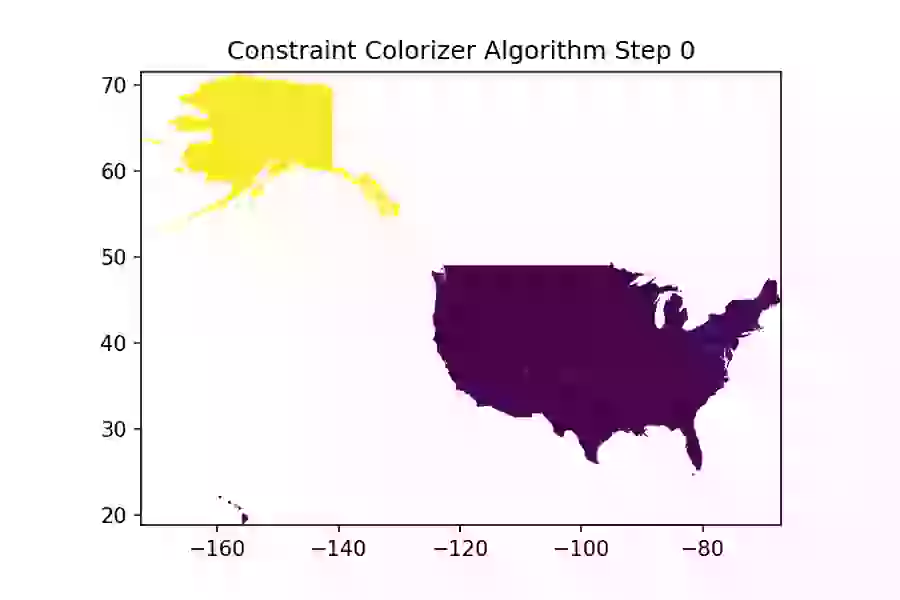
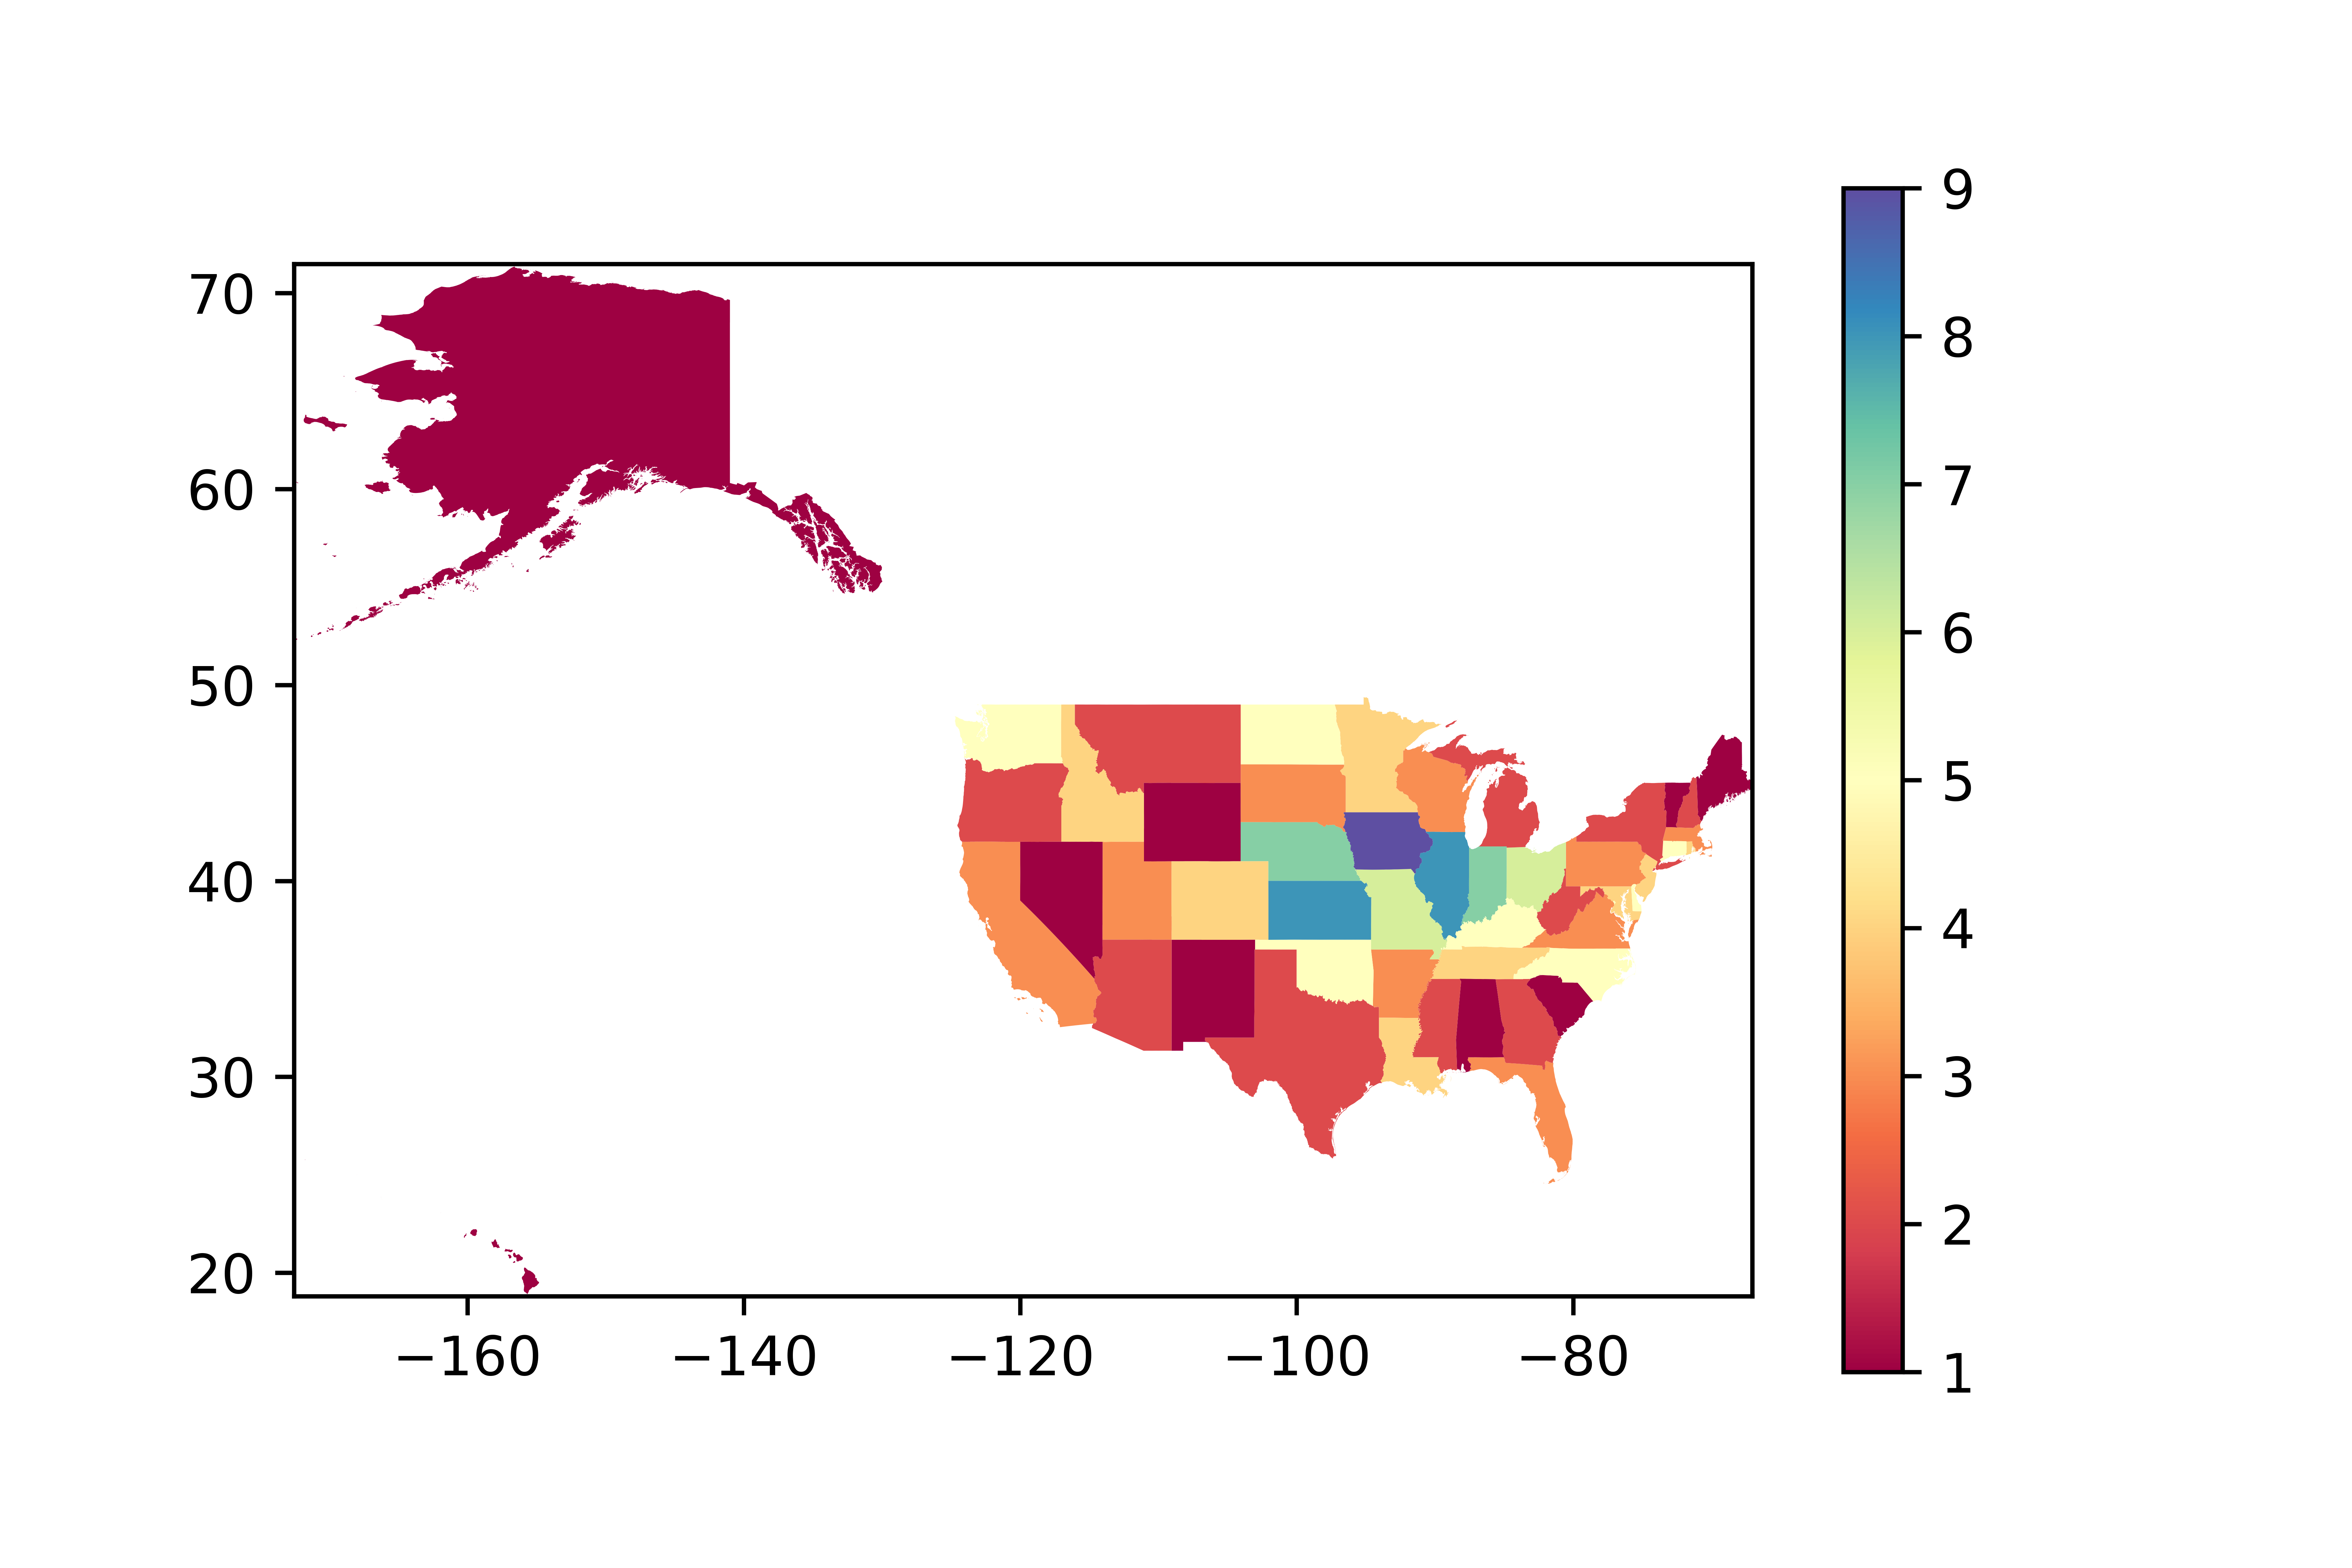
USA states colored based on Forest + Park + Grassland landcover percentage. Data source: USDA ERS - Major Uses of Land in the United States 2012
A twist on the four color theorem. This coloring algorithm solves the minimum number of colors needed to uniquely color a map if each map region must be meaningfully colored in relation to neighbors' attributes (population, landmass, forest cover, etc). The algorithm assigns colors to regions to produce a map without two identical colors touching. Download colorizedMap_XXX.png images to view example outputs coloring the USA based on natural resource features.
Guaranteed unique coloring (categories) with each region's color reflecting a qualitative comparison to the neighbors' values.
In the below example, adjacent regions are colored from dark -> light based on numerical value (greater->smaller).
This is a work in progress and more details will be added in the future.
I am currently using this algorithm in conjunction with DEM to STL pipeline at https://github.com/ansonl/DEM2STL to print all US states with rivers highlighted in a secondary color.
-
Populate Shapefile geographic-data/cb_2019_us_state_500k/cb_2019_us_state_500k.shp with a value (ex: population, wildlife, landmass) for each feature/region in a column. QGIS or ArcGIS may be used to edit Shapefiles.
-
Edit mapConstraintColorizer.py to use your values' columns.
-
Run mapConstraintColorizer.py to generate image.
- Use gif2webp to convert to webp format with maximum lossy compression. 70 MB GIF -> 25 MB WebP
./gif2webp.exe ~/development/mapConstraintColorizer/geographic-data/animated.gif -o animate.webp -lossy -m 6 -q 0 -mt -kmax 0 -f 20 -mixed
- All code in this project is free for both commercial and non-commercial use. Attribution to Anson Liu is required for commercial and academic use.


