This is a report regarding the second lab of Computer Architecture course at the Aristotle University of Thessaloniki.
Below are the answers to the questions put in the context of the second lab exersice, in the order they were given:
In this first part we ran a series of simulations based on the se.py example CPU model with L2 Cache configuration built within gem5. The simulations ended after completing the execution of 100000000 instructions in the following benchmarks:
- specbzip
- specmcf
- spechmmer
- specsjeng
- speclibm
- After the completion of all five simulations we were able to retrieve the following statistics regarding the simulated memory subsystem:
| committed.Insts | committed.ops | discarded.ops | L2.block.replacements | L2.accesses | |
|---|---|---|---|---|---|
| specbzip | 100000001 | 100196363 | 190645 | 710569 | 712341 |
| specmcf | 100000001 | 109431937 | 690949 | 54452 | 724390 |
| spechmmer | 100000001 | 101102729 | 974536 | 65718 | 70563 |
| specsjeng | 100000001 | 184174857 | 4279 | 5262377 | 5264051 |
| speclibm | 100000001 | 100003637 | 2680 | 1486955 | 1488538 |
- Commit is the last step to the execution of an instruction. Some instructions are executed speculatively, due to the existance of branches in the code, to which the processor cannot have the answer soon enough. So, if a mis-prediction of a branch's result occurs, the speculatively executed instructions are being discarded. Therefore, the number of committed instructions and the number of executed instrctions can almost never be the same.
In the stats.txt file we extracted after the completion of the simulations, we weren't able to find a single statistic that showed the number of the executed instructions in total. We did manage to find though, the number of committed operations, which include micro operations, and the number of the discarded operations. The sum of these two can show us the total number of executed operations:
| commited.ops | discarded.ops | |
|---|---|---|
| specbzip | 100196363 | 190645 |
| specmcf | 109431937 | 690949 |
| spechmmer | 101102729 | 974536 |
| specsjeng | 184174857 | 4279 |
| speclibm | 100003637 | 2680 |
- The number of L2 accesses was given in the stats.txt file. In case it wasn't, we could easily compute it by adding the overall hits and misses in the L2 cache.
- We also kept track of a list of statistics during these several simulations of the different benchmarks in order to check how well the system handled each one and to see where there was room for improvement. More specifically:
| sim.seconds | CPI | dcache.miss.rate | icache.miss.rate | L2.miss.rate | |
|---|---|---|---|---|---|
| specbzip | 0.083982 | 1.679650 | 770644 | 747 | 200996 |
| specmcf | 0.064955 | 1.299095 | 75340 | 668914 | 39875 |
| spechmmer | 0.059396 | 1.187917 | 71886 | 3821 | 5487 |
| specsjeng | 0.513528 | 10.270554 | 10523861 | 649 | 5263903 |
| speclibm | 0.174671 | 3.493415 | 2975818 | 558 | 1488455 |
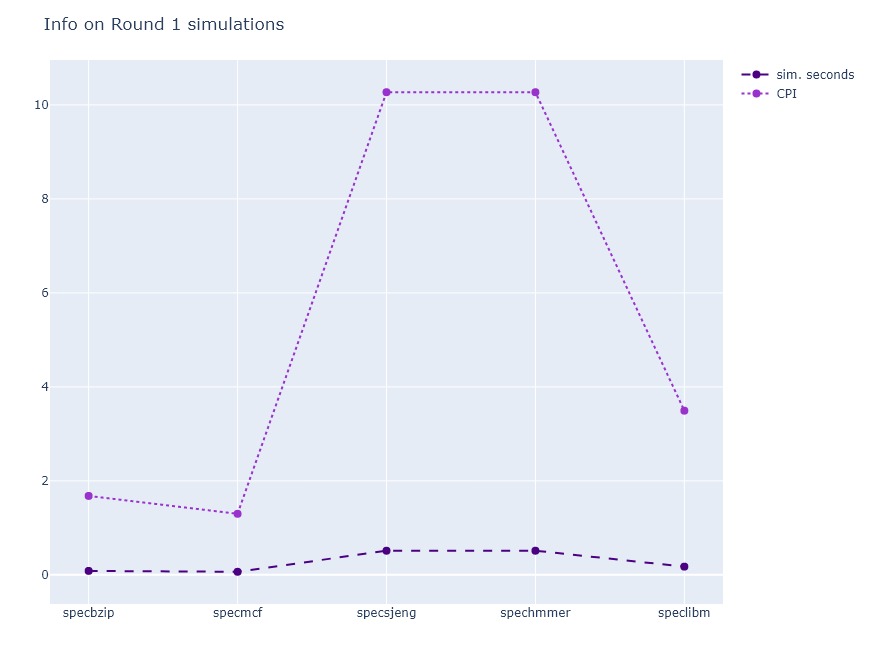
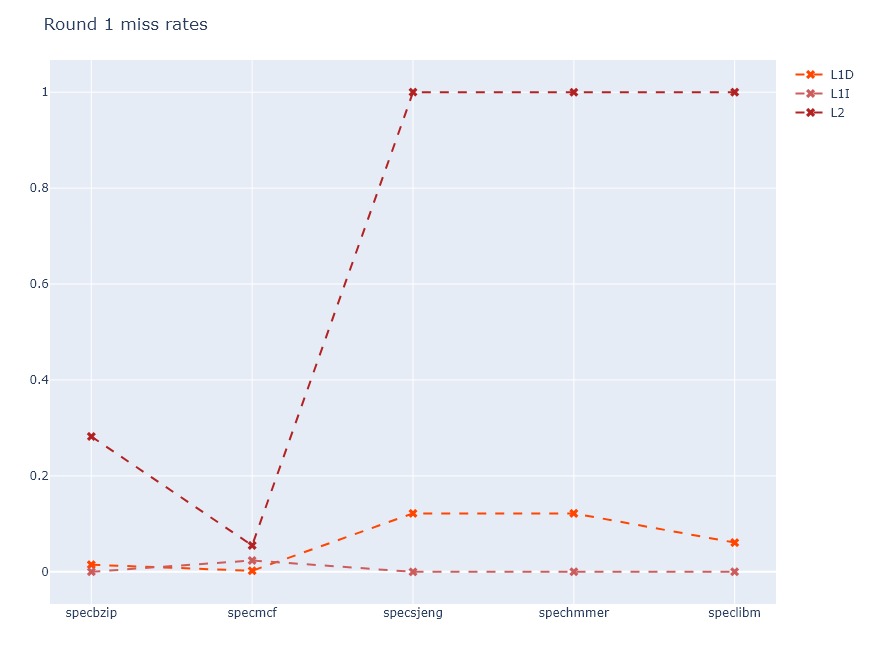
We can see the differences in these statistics among the 5 benchmarks more clearly in the following graphs:
- Next, we ran the same set of bechmarks on a simulated system, which was exactly the same as before, with the only difference being that the Clock Rate was 1.5GHz. We were able to change this parameter by adding a CLOCK variable in MakeFile:
(CLOCK = --cpu-clock)and making it equal to 1.5GHz and 2GHz for the last simulation rounds.
We searched the config.json files for clock information. More Specifically:
- system.clk_domain.clock
- system.cpu_clk_domain.clock
| 1GHz | 1.5GHz | 2GHz | |
|---|---|---|---|
| system.clk_domain.clock | 1000 | 1000 | 1000 |
| system.cpu_clk_domain.clock | 500 | 667 | 500 |
Note: The clocks signify the numbers of ticks per period. A tick is equal to 10-12 seconds.
After looking at the Options.py file in the common folder, we can make a conclusion about the default values of the system and CPU clocks:
# @file: Options.py
parser.add_option("--cpu-clock", action="store", type="string",
                      default='2GHz',
                      help="Clock for blocks running at CPU speed")
# @file: Options.py
parser.add_option("--sys-clock", action="store", type="string",
default='1GHz',
help = """Top-level clock for blocks running at system
speed""")Thus, we expect an additional CPU to be configured at 2GHz by default.
What needs to be remarked is the fact that the CPU clock doesn't directly affect the simulation times, as we may have expected. This is most likely a result of the fact that the system and CPU clocks don't coincide, which means perfect synchronisation is likely unattainable. In a nutshell, the CPU may be ready to execute another operation, but the caches probably didn't have the time to get the operands ready. Consequently, the CPU has to stall for the most part, leading to cycles completely lacking of operations.
In this part we ran 9 rounds of simulations of the above mentioned benchmarks. In each round, we changed single or multiple parameters regarding the CPU and the memory subsystem. More specifically, we messed with:
- CPU Clock
- L1 & L2 Associativity
- Cache Line Size
- Data Cache , Instruction Cache and L2 Cache Size
Please note, all the graphs we produced can be found in the output folder
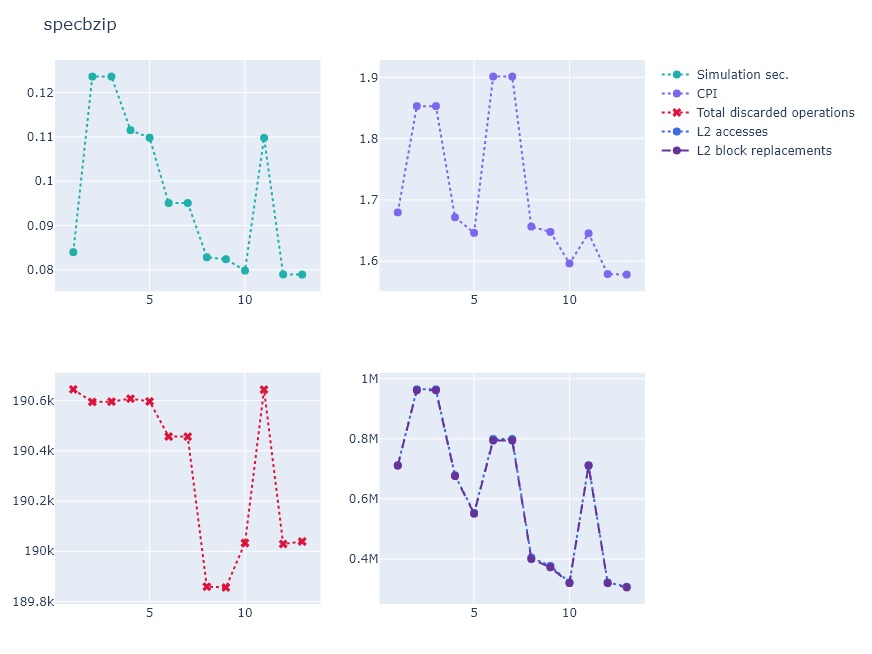
Let's take specbzip for example, which had an indicative behaviour as to the most common. As we look at the CPI graph, we can clearly see a massive drop between rounds 3 and 4. The CPI goes back up again for rounds 6 and 7 and after round 8 we see an even bigger drop. All we did in the fourth round was bump up L1D cache from 64kb to 128kb and increase the cache line size from 32 bytes to 64 bytes. These types of changes seemed to affect the CPI more than any other change we made. Increasing the line size also increases the block size, so, in this way, the memory subsystem shows better support of the spatial locality, which has shown to have a great impact on the system's performance on most types of processes.
The size increase of the DCache, on the other hand, is more obvious to affect performance in a positive way. The miss rate is greatly reduced as more blocks are easily accesible from the processor inside the cache itself. Bigger cache sizes result in slower hit times and greater manufacturing costs.
In general, these were the most impactful changes that benefited the performance.
Architecture optimization subsequently means constant concern for cost optimization as well. There are certain factors that affect implementation and manufacturing costs. In general:
-
Cache size increases the cost of manufacturing because of more materials being used. Also hardware speed is reduced.
-
Cache Associativity increase results in more complex hardware so the cost is somewhat increased. There is a significant decrease in CPI because of smaller miss rates./
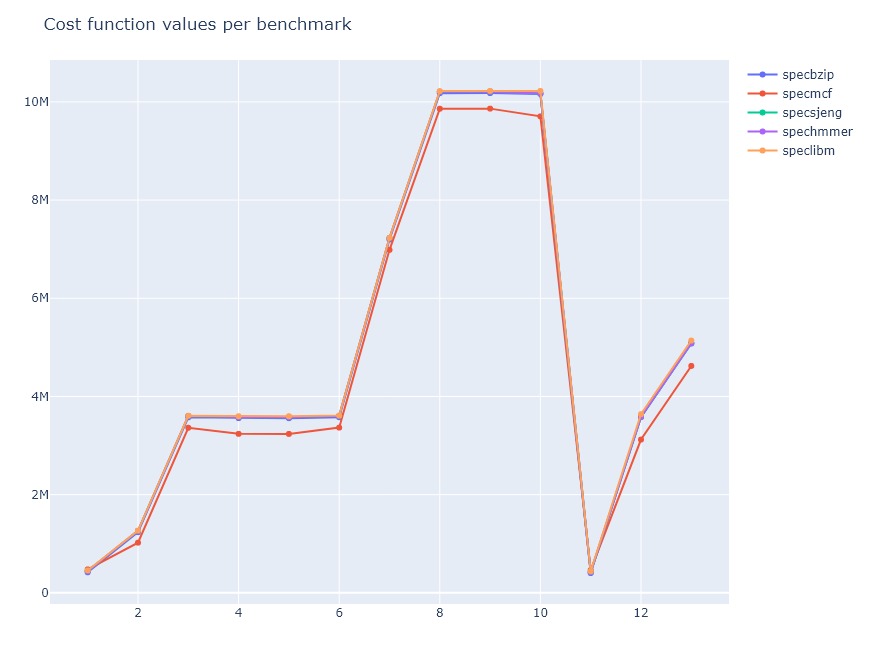
We composed a cost function that compares the cost of the changes we make to the caches to the speedup they offer. The system configuration that secures the lowest cost function value is the ideal. Using this reference we discovered that associativity influences the complexity weakly and non-linearly, which led us to the formula below:
Note: The sizes of L1 cache were in kB and the corresponding L2 sizes are kept in MB.
| icache.size | dcache.size | l2cache.size | icache.assoc | dcache.assoc | l2cache.assoc | |
|---|---|---|---|---|---|---|
| round 1 | 32KB | 64KB | 2MB | 2 | 2 | 8 |
| round 2 | 128KB | 64KB | 1MB | 1 | 1 | 2 |
| round 3 | 256KB | 64KB | 1MB | 2 | 1 | 2 |
| round 4 | 256KB | 128KB | 1MB | 2 | 2 | 2 |
| round 5 | 256KB | 128KB | 1MB | 2 | 2 | 2 |
| round 6 | 256KB | 128KB | 1MB | 2 | 2 | 2 |
| round 7 | 512KB | 128KB | 1MB | 2 | 2 | 2 |
| round 8 | 512KB | 128KB | 1MB | 4 | 1 | 2 |
| round 9 | 512KB | 256KB | 1MB | 4 | 2 | 4 |
| round 10 | 512KB | 256KB | 2MB | 4 | 2 | 4 |
| round 11 | 32KB | 64KB | 2MB | 2 | 2 | 4 |
| round 12 | 256KB | 256KB | 4MB | 2 | 2 | 8 |
| round 13 | 256KB | 256KB | 4MB | 4 | 4 | 8 |
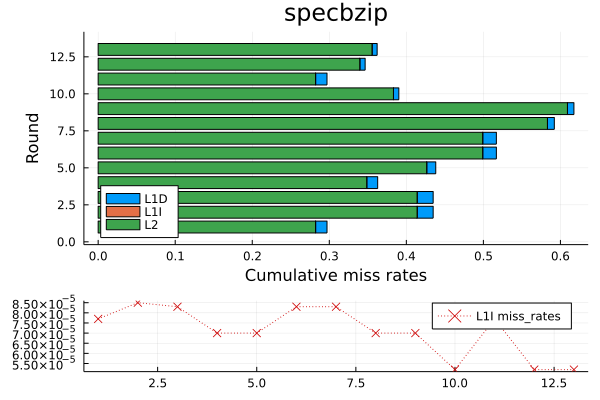
By looking at the following graph, we can see that the optimal configuration for all five benchmarks is this of round 11. Therefore, this is the configuration that achieves high perfomance, while maintaining a relatively low cost.
During the execution of the various tasks required for the completion of the assignment, we were able to discover how useful and powerful the composure of a properly structured and thought-out Makefile can be. The majority of the tests we conducted were based on the Makefile script we have attached to the project and made our job much easier. This is due to the fact that it allowed us to be productive while we had time, not having to wait for test results when we needed to use the resources we had available.
Moreover, we were able to get even more familiar with Git, avoiding merge conflicts when working on the same parts of the projects simultaneously, and version control in general.
Needless to say, this part of the assignment was also most useful to us learning the purpose and the fundamentals of the course at hand, enabling us to discover the influence of each component of a computer architecture design both on performance and manufacturing cost. Generally speaking, we were able to discuss the matters each member of the team had engaged in and gained knowledge through solving the challenges each one had to face.
