Struggle 2000 lets you create your own custom running routes and activities. You can view your aggregated activities and routes to see your progress over time.
struggle 2000 runs on a PRRRR stack:
- P - Postgres is the database being used to store user information, route data, and activity data
- RR - Ruby on Rails is the backend component which handles requests to the database and formats the data sent to the frontend
- RR - React and Redux are the frontend components which maintain frontend state and render the individual pages a viewer sees when navigating the site
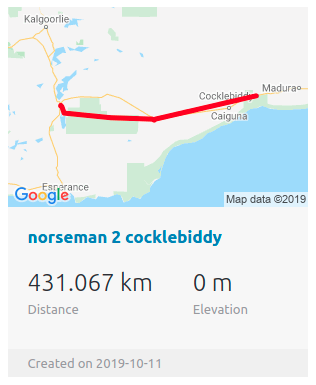
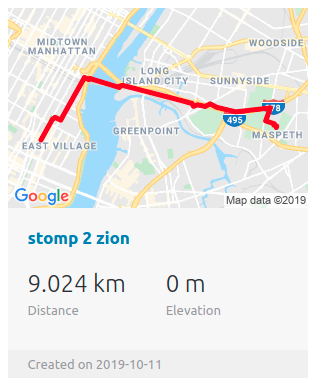
Displaying route maps implements a completely separate API from the route creator. This static maps API conveniently takes in a string of concatinated coordinates separated by a | character to display routes in the query string request to the api. This makes calling route data from the database simple as it is already saved in this specific format instead of an array or object. The static maps are their own component, so they can be iterated over simply and displayed in a flexbox in the route index. Individual route display tiles look like the following:
Displaying the index of all of a users activities is another important feature. This tabled display allows a user to compare their stats for all of their recorded activities over time. They are presented in an clean and orderly format. Additionally, none of the data besides the sport and title is mandatory, so a user can create a new activity even if they don't have access to the full range of data asked for in the form.
Below are some specific parts of the project I feel particularly proud of:
-
`const activities = this.props.activities.map(activity => {
      if(i % 2 === 0){
          cName = "table-row-dark"
          i++
      } else if (i % 2 === 1) {
          cName = "table-row-light"
          i++
      }

      if (activity.distance !== null) {
          activity.distance += " km"
      }

      if (activity.elevation !== null) {
          activity.elevation += " m"
      }

      return(

          <tr key={activity.id} className={cName}>
              <td>{activity.sport}</td>
              <td>{activity.date}</td>
              <td>{activity.title}</td>
              <td>{activity.time}</td>
              <td>{activity.distance}</td>
              <td>{activity.elevation}</td>
          </tr>
      )
  })`
This piece maps a user's activities prop array as a table row of html table datums. It alternates between light and dark background colors by specifying a css background property on even and odd numbers. Units of measure are then added by checking if the associated activity is not null and concatinating a string on the end (just for display) of the data value.
-
`const activitiesTitles = this.props.activities.reverse().map(activity => { if (i < 6) i++
return <li>{activity.title}</li>})`
This piece iterates through a user's activities in reverse order and returns a list of most recent activities (since the activities array is populated in order of creation). These li elements are display in the footers thorughout the project.
-
Add support for extra datatypes in the form. Right now, only distance and elevation have reliable data input fields. This will be extended to duration, exertion, and date.
-
Improve map editor stability. Clearing routes in the route editor requires a browser refresh to edit again after clearing. Additionally, altering coordinates by dragging route waypoints should persist in the database.
-
Adding location search to route creation. Location search is a separate google api that can search map coordinates based on location names. This will make creating route much more intuitive to users.
-
Adding user feed to dashboard. A user should be directed to their feed upon login which displays all of their routes and acivties ordered by most recent.
-
Adding individual show pages to activities and routes. These show pages will incorporate more detailed information like elevtion profile maps and activity comments.
-
Connecting Route and Activity data. A user should be able to assign a workout to a specific route. This way they already know the distance and elevation, and can compare time and exertion against previous attempts at that route.


