An implementation of the Viscous Vortex Domains (VVD) method.
The VVD method is a mesh-free method of computational fluid dynamics for directly numerically solving 2D Navier-Stokes equations in Lagrange coordinates. It doesn't implement any turbulence model and free of arbitrary parameters.
curl -s https://packagecloud.io/install/repositories/vvflow/stable/script.deb.sh | sudo bash
sudo apt install vvflow
For today, binary packages are available for ubuntu 18.04 (bionic), 20.04 (focal), 20.10 (groovy). On other Linux platforms, it can be built from source.
Don't hesitate to open an issue if you encounter any problems.
For a start, one can copy the example simulation from doc:
cp -R /usr/share/doc/vvflow/example/ ./
cd example
make
This will compose the CFD problem as described in cylinder.lua file,
run the simulation (for a minute or two), and plot the results.
Defining the CFD problem is handled by the vvcompose tool. It's a
Lua interpreter, so it supports everything that Lua supports
(and even more).
Flow around circular cylinder:
#!/bin/bash
vvcompose <<SCRIPT
    S.inf_vx = "1"
    S.re = 600
    S.dt = 0.005
    S.dt_save = 0.1
    S.finish = 500

    cyl = gen_cylinder{R=0.5, N=350}
    cyl.label = "cyl"
    S.body_list:insert(cyl)

    S.caption = "re600_n350"
    S:save(S.caption..".h5")
SCRIPTThe flow simulation itself is performed by vvflow tool:
vvflow --progress --profile re600_n350.h5
The vvflow can be run on a PBS cluster:
#!/bin/bash
qsub -d. -l nodes=1:ppn=6 -N testrun <<'EOF'
    export OMP_NUM_THREADS=$PBS_NUM_PPN;
    exec vvflow re600_n350.h5;
EOFThe results are saved to the current working directory during the simulation:
stepdata_re600_n350.h5- integral parameters (forces, dispositions) time series.results_re600_n350/*.h5- vortex distributions over time.
Those are raw data, which can be processed using one of the following:
The vvxtract tool is the opposite of the vvcompose.
It prints .h5 file content in a human-readable form.
$ vvxtract re600_n350.h5
-- space
S.re = 600
S.inf_vx = '1'
S.time = '0/1' -- 0
S.dt = '5/1000' -- 0.005
S.dt_save = '1/10'
S.finish = 500
-- #S.body_list = 1 -- number of bodies
-- #S.vort_list = 0 -- number of vortex domains
-- #S.sink_list = 0 -- number of sinks and sources

-- body00 (cyl)
cyl.label = 'cyl'
cyl.slip = false -- no-slip
-- #cyl = 350 -- number of segments
-- cyl.get_axis() = {0, 0} -- rotation axis
-- cyl.get_cofm() = {0, 0} -- center of mass
-- cyl.get_slen() = 3.14155 -- surface length
-- cyl.get_area() = 0.785356
-- cyl.get_moi_cofm() = 0.0981642
-- cyl.get_moi_axis() = 0.0981642
Stepdata files can be handled the same way:
$ vvxtract stepdata_re600_n350.h5 time body00/force_hydro | less
#time   body00/force_hydro[1]   body00/force_hydro[2]   body00/force_hydro[3]
+0.000000e+00   +3.140723e+02   -2.296381e-13   +5.088693e-15
+5.000000e-03   +2.557315e+00   +1.390750e-04   -1.982764e-14
+1.000000e-02   -1.157489e+00   +4.054699e-04   +1.064268e-04
+1.500000e-02   +8.585840e-01   -1.463448e-01   -6.041857e-02
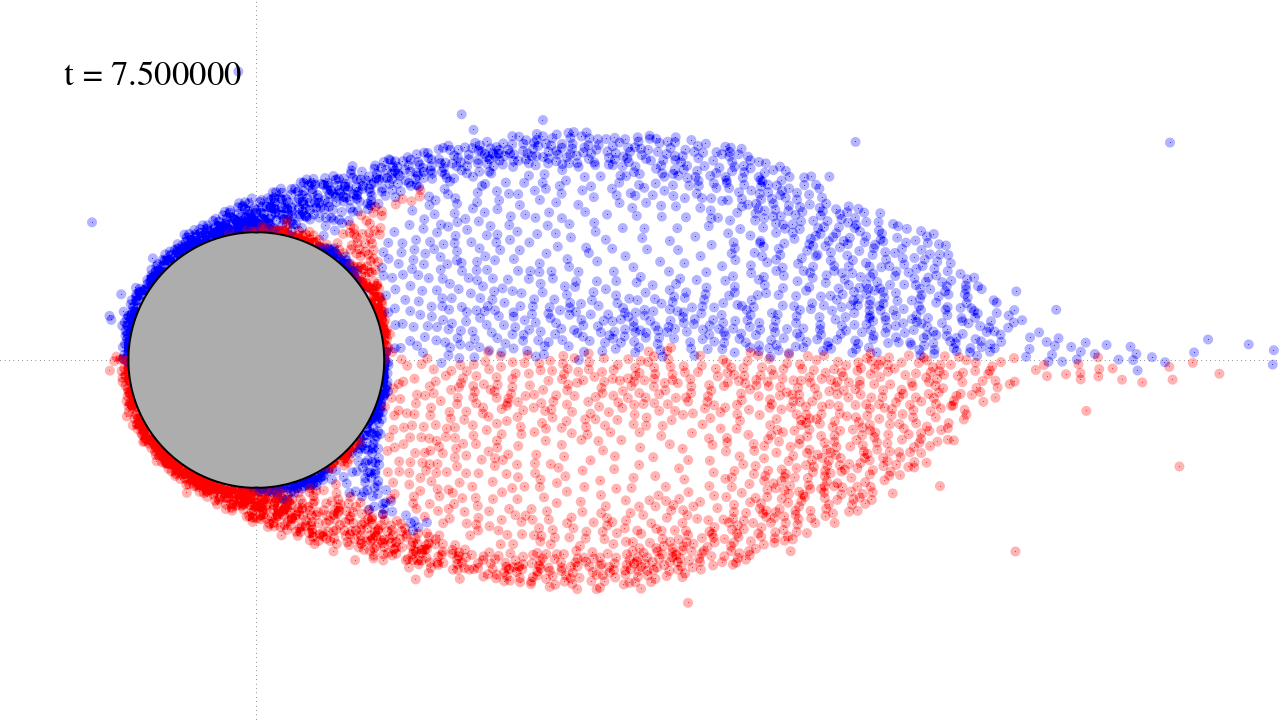
...To plot the images use vvplot tool:
vvplot re600_n350.h5 ./ -B -x -1,4
vvplot results_re600_n350/000150.h5 ./ -B --V 10 -x -1,4
Draw an animation:
mkdir -p images
ls results_re600_n350/*.h5 | xargs -I{} vvplot {} ./images -BV -x -2,20
A single movie can be encoded with the vvencode tool - a small
wrapper script for the FFmpeg:
vvencode 'images/*.png' re600_n350.mp4This is a bunch of helpful awk scripts, like command-line MS-Excel.
It can be very useful in combination with vvxtract.
vvawk.avg: the arithmetic mean in a column.vvawk.sd: the standard deviation in a column.vvawk.zeros: find zeroes.vvawk.mavg: the moving average in a column.vvawk.drv: the derivative.vvawk.ampl: the amplitude in a column -avg(max) - avg(min).
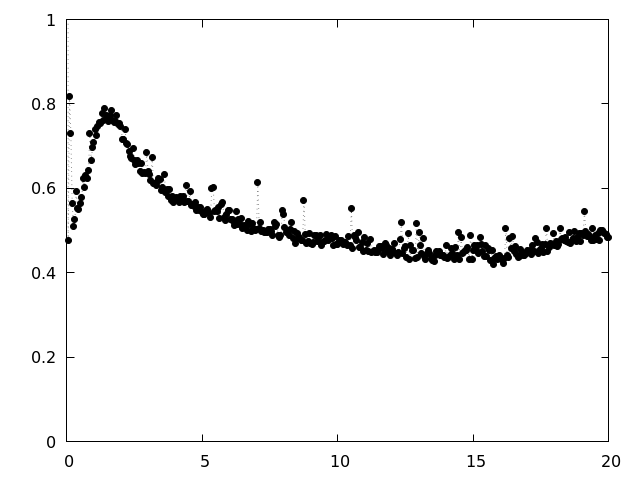
The gpquick tool is used to preview plots.
vvxtract stepdata_re600_n350.h5 time body00/force_hydro \
| gpquick --points -y 0 1 \
| display
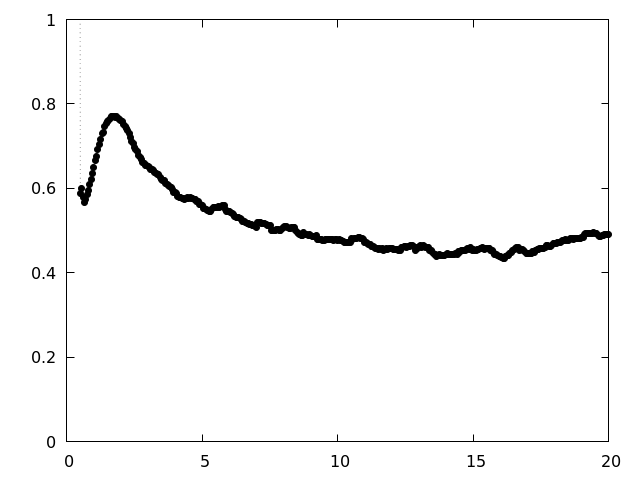
In combination with vvawk.mavg (moving average):
vvxtract stepdata_re600_n350.h5 time body00/force_hydro \
| vvawk.mavg -v span=10 - \
| gpquick --points -y 0 1 \
| displayInstall build dependencies:
sudo apt-get update
sudo apt-get install build-essential cmake make git liblapack-dev
Build the project:
git clone https://github.com/vvflow/vvflow.git
cd vvflow
cmake .
make -j
sudo make install


