pilots_views
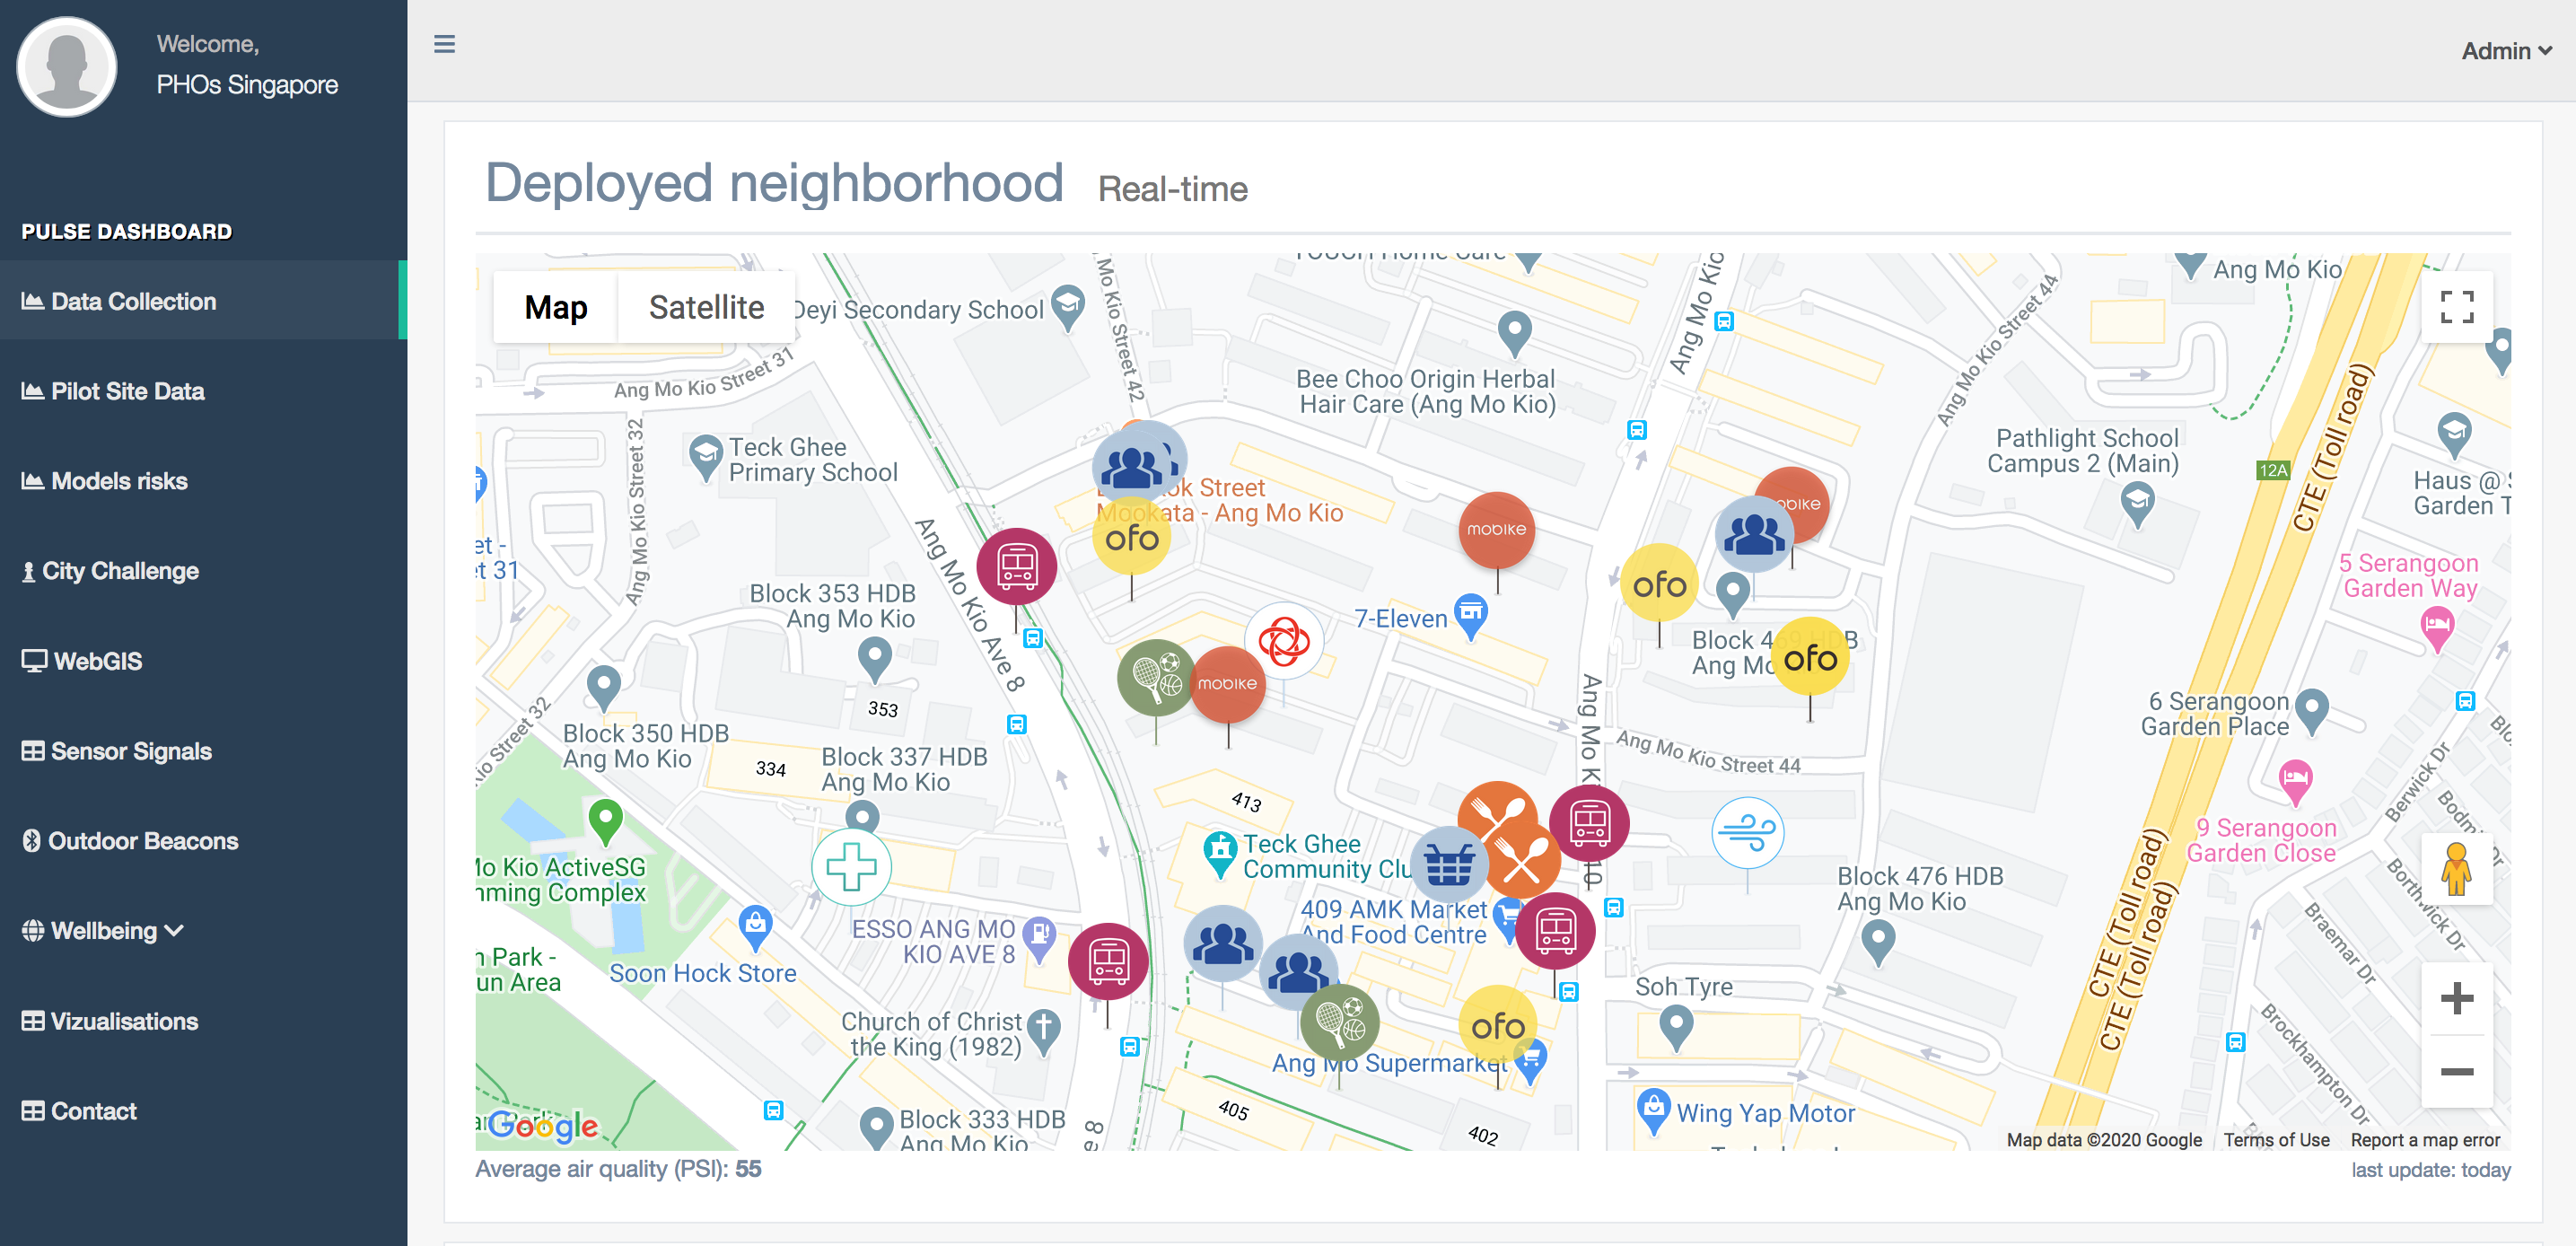
Live dashboard for Health Observatories (open from production folder)
Setting Places of Interests (PoI) over Google Map layer
var beacon_SACAntenna = new google.maps.LatLng(1.36459035, 103.85693395); var beacon_BusStation3 = new google.maps.LatLng(1.362866, 103.855947); var marker_blk406A = new google.maps.Marker({position: beacon_blk406A, map: map, animation: google.maps.Animation.DROP, icon: markerImageCC});

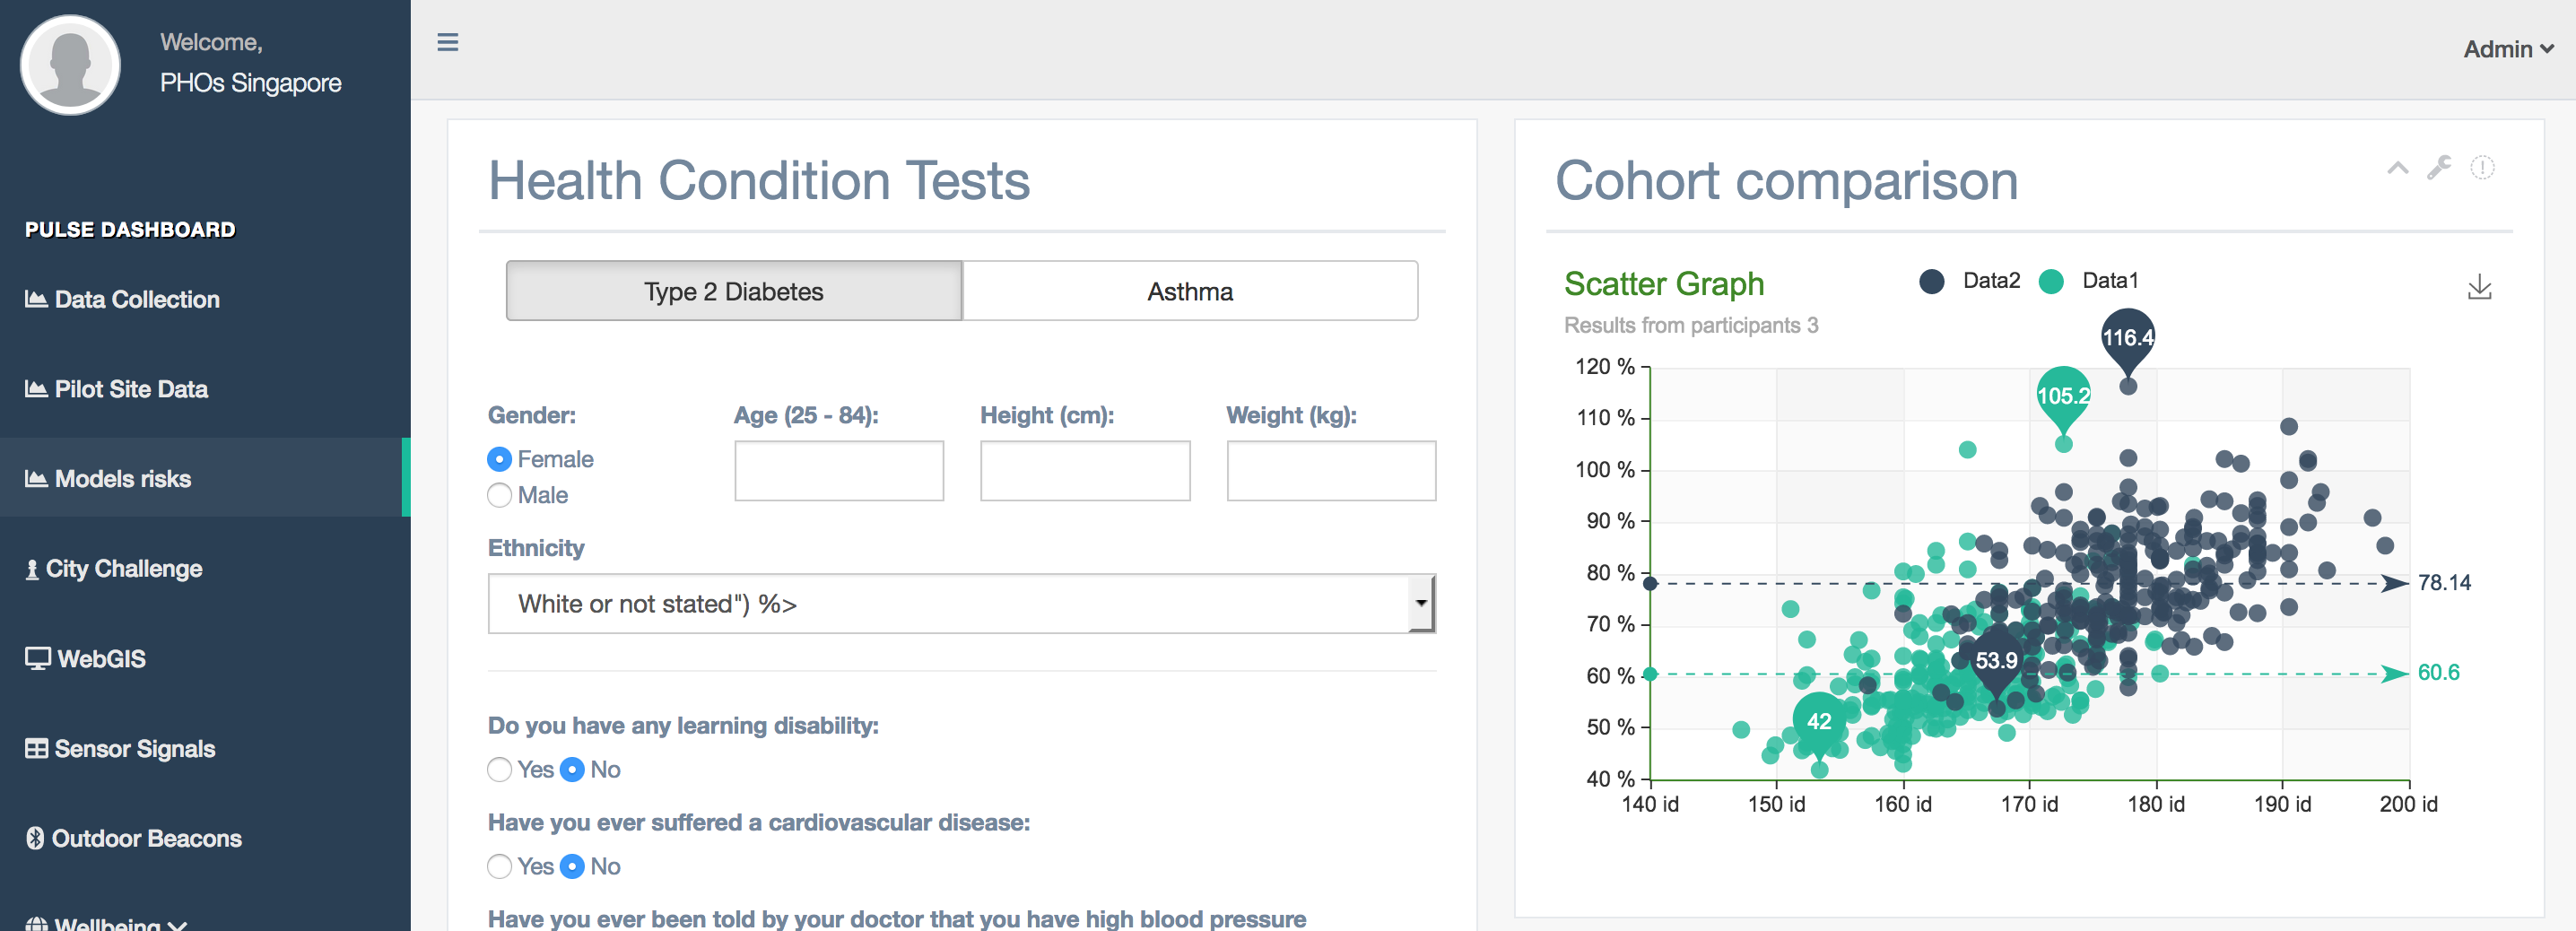
Risk models Calculator
Not activated in this version.

Cohort Plot
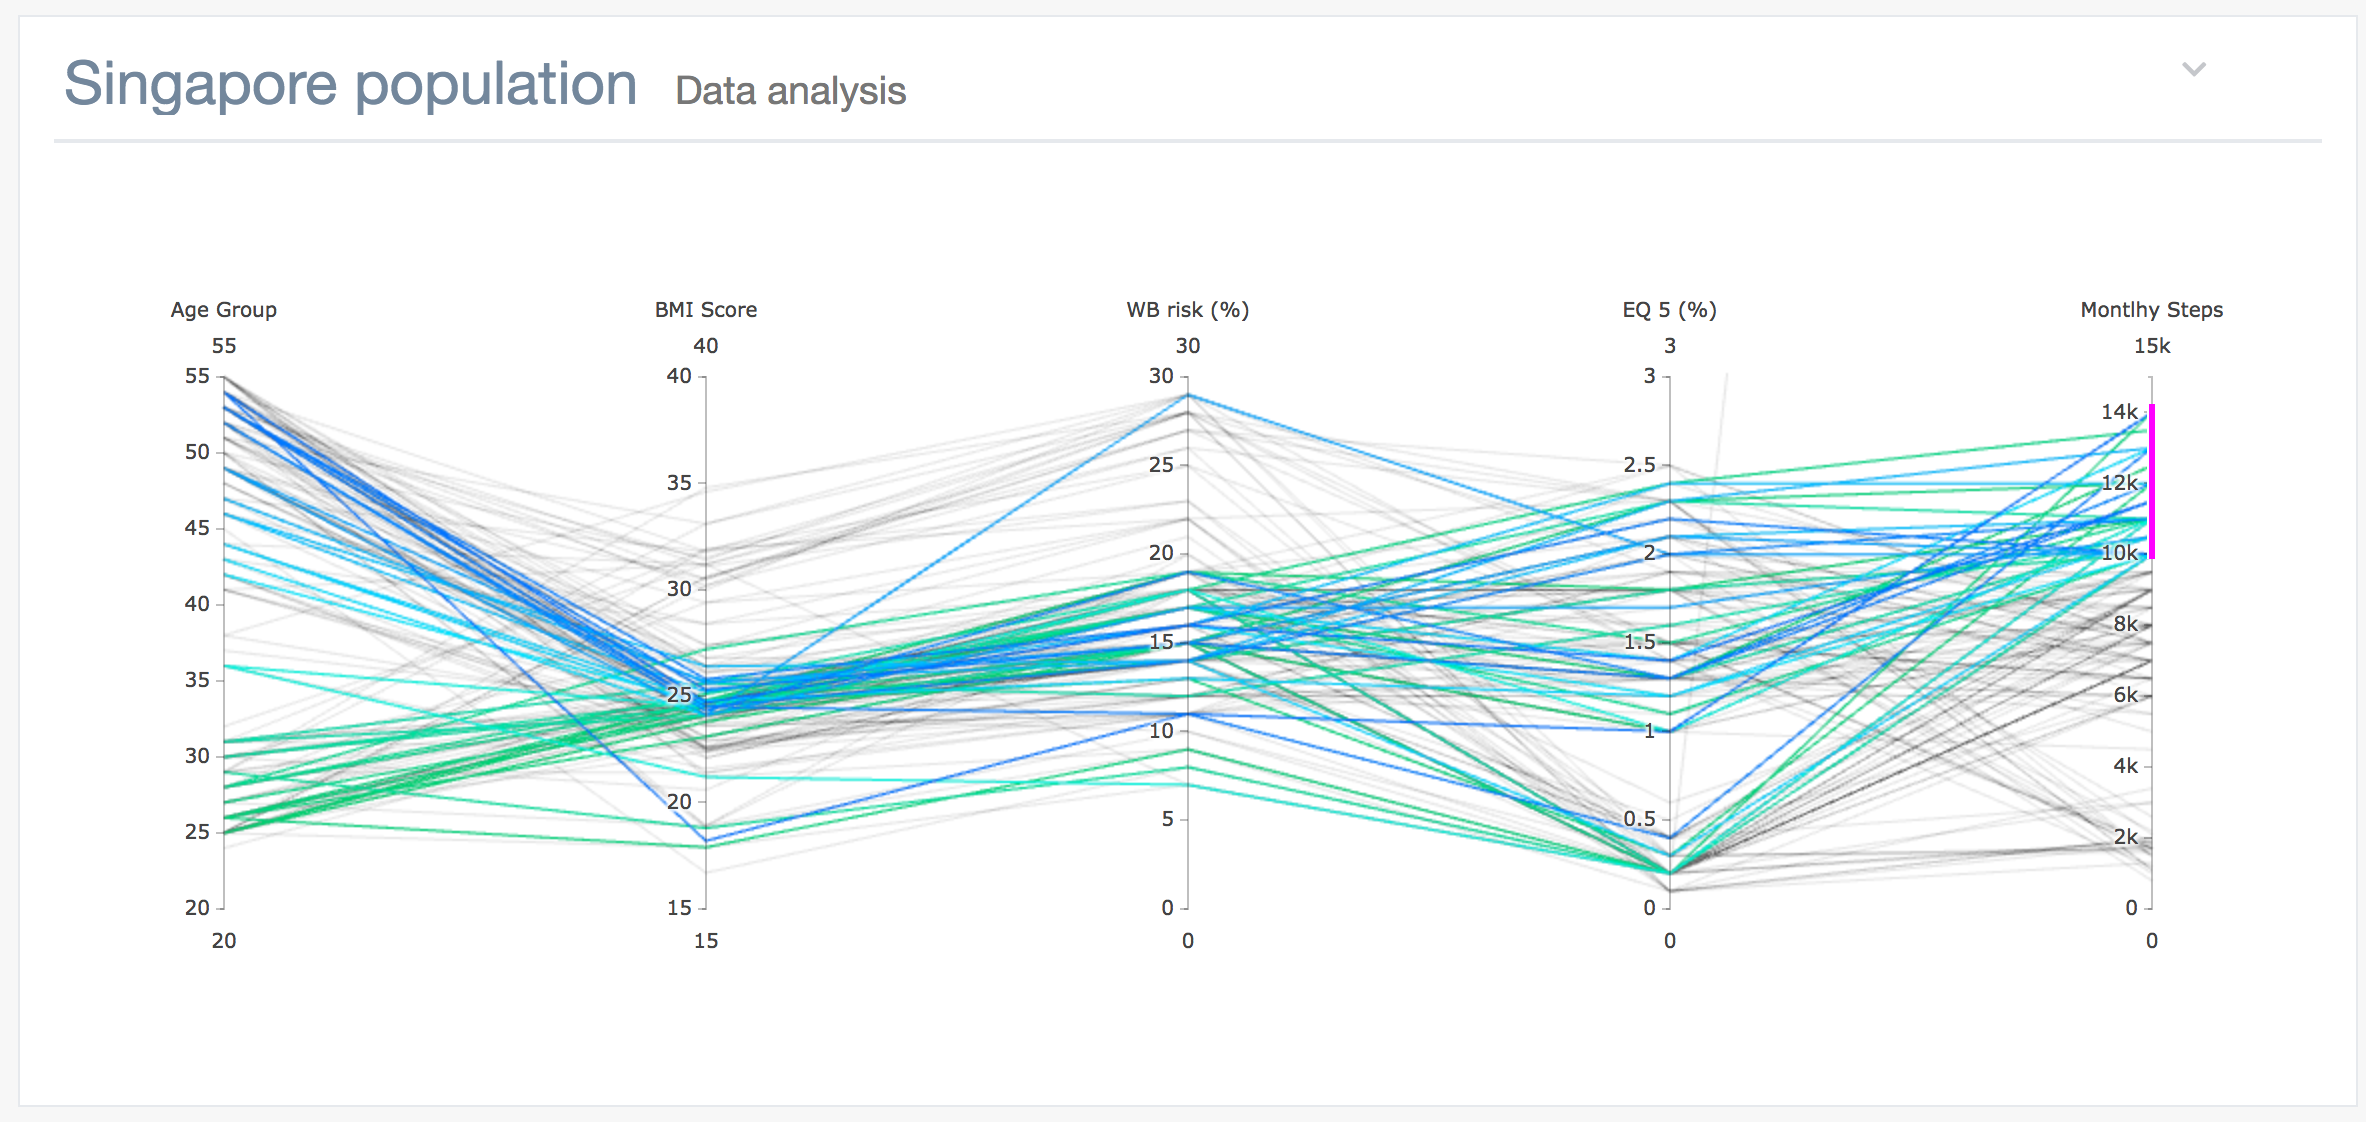
Visualizing high-dimensional geometry and analyzing multivariate data for profile and survey data, serving data from online CSV: https://github.com/antoinedme/SurveyPulseView1/blob/master/PULSEDATAVIEWIMT.csv Available data parameters are:
age_groupParticipant's age (years old)bmi_scoreCalculated (Body Mass Index), approximate measure of your total body fatframinghamThe Framingham Coronary Heart Disease Risk Score estimatesscoreGeneral Well-being Risk Score estimatesmonthly_stepsEstimated wearable or declared physical activity A point in n-dimensional space is represented as a polyline with vertices on the parallel axes; the position of the vertex on the i-th axis corresponds to the i-th coordinate of the point. Used for statistical considerations and cohort identification/selection.
Using JS libraries:
<script src="js/Chart.min.js"></script>
<script src="../vendors/jquery-sparkline/dist/jquery.sparkline.min.js"></script>
<script src="../vendors/Flot/jquery.flot.js"></script>
<script src="../vendors/echarts/dist/echarts.min.js"></script>
<script src="../vendors/echarts/map/js/world.js"></script>