Script to produce radial convergence plots (or chord plots) for Sobol sensitivity analysis results or other purposes
This script produces two radial convergence graphs (aka chord graphs) for Sobol Sensitivity Analysis results in a dictionary format. It can directly work with Sobol results produced by Rhodium (https://github.com/Project-Platypus/Rhodium), as well as Sobol results using SALib (https://github.com/SALib/SALib), after conversion as shown in salib_example.py. It will produce one graph with straight lines and one with curved lines (parabolas). Written by Antonia Hadjimichael (https://github.com/antonia-had) based off code by Enrico Ubaldi (https://github.com/ubi15/). The script was written and tested in Python 3.6 and 3.7.
To use with any SALib or Rhodium output from a Sobol Sensitivity Analysis, either use directly, or save output as npy like so:
dictionary = {'key':'contents'} <- SA results
np.save('SAresults.npy', dictionary)
You will need to install the NetworkX package (https://networkx.github.io/) before running.
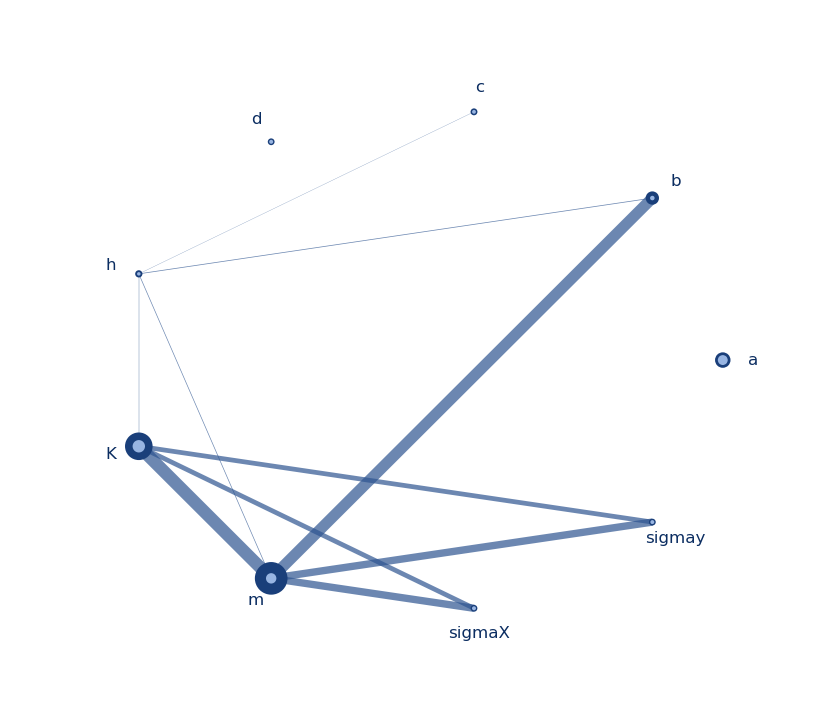
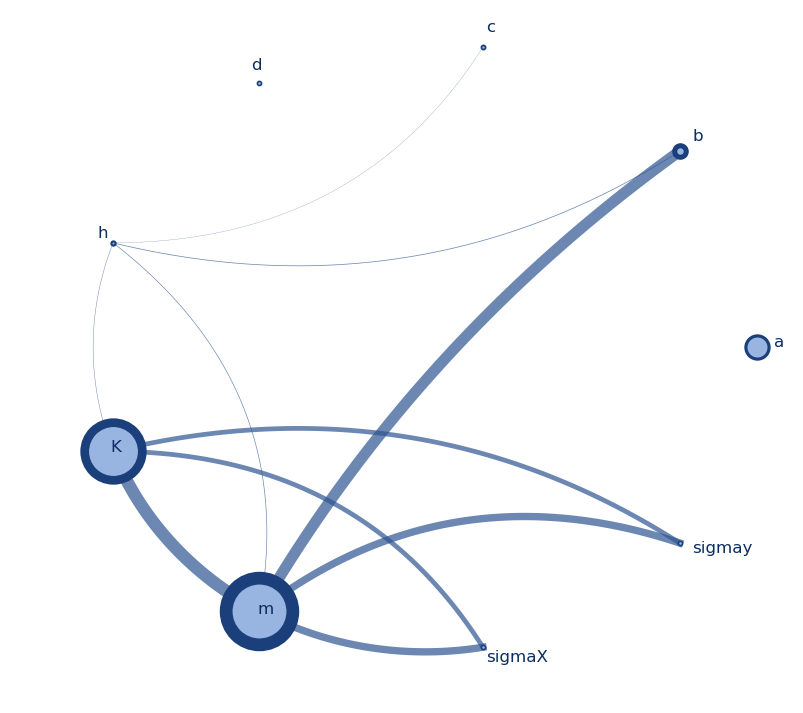
The script produces the figures below, where node size indicates the first order index (S1) per parameter, the node border thickness indicates the total order index (ST) per parameter, and the thickness of the line between two nodes indicates the secord order index (S2). The colors, thicknesses, and sizes can be easily changed to fit your needs.