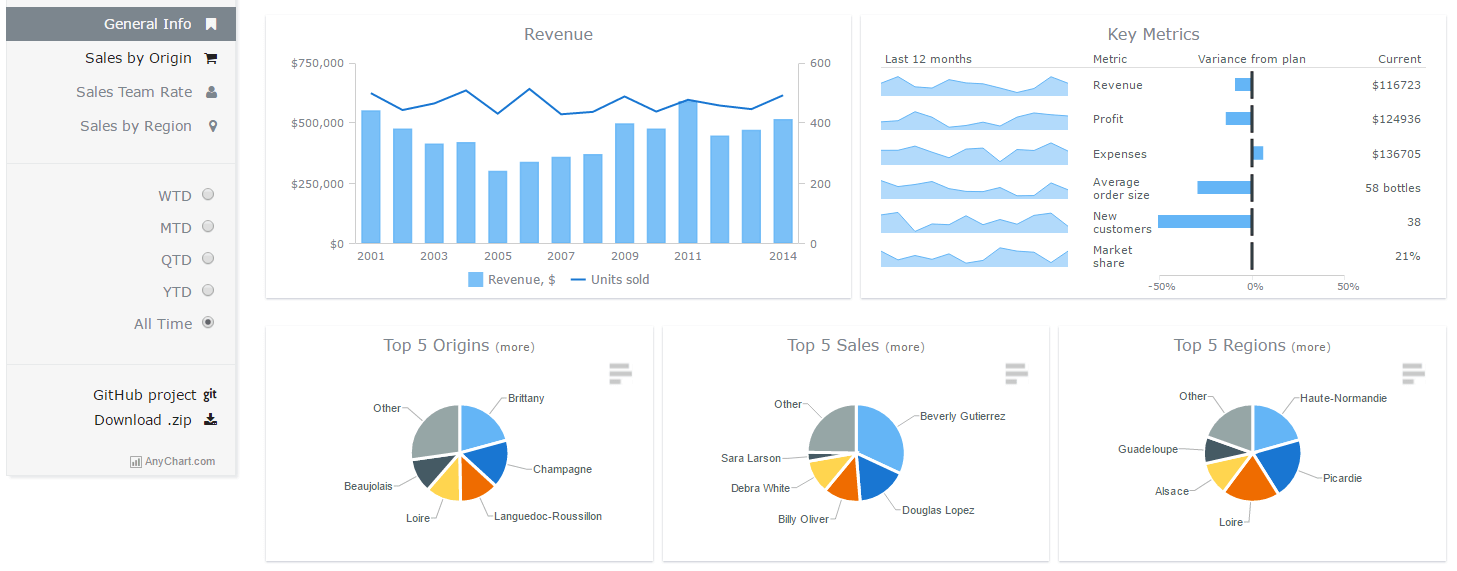
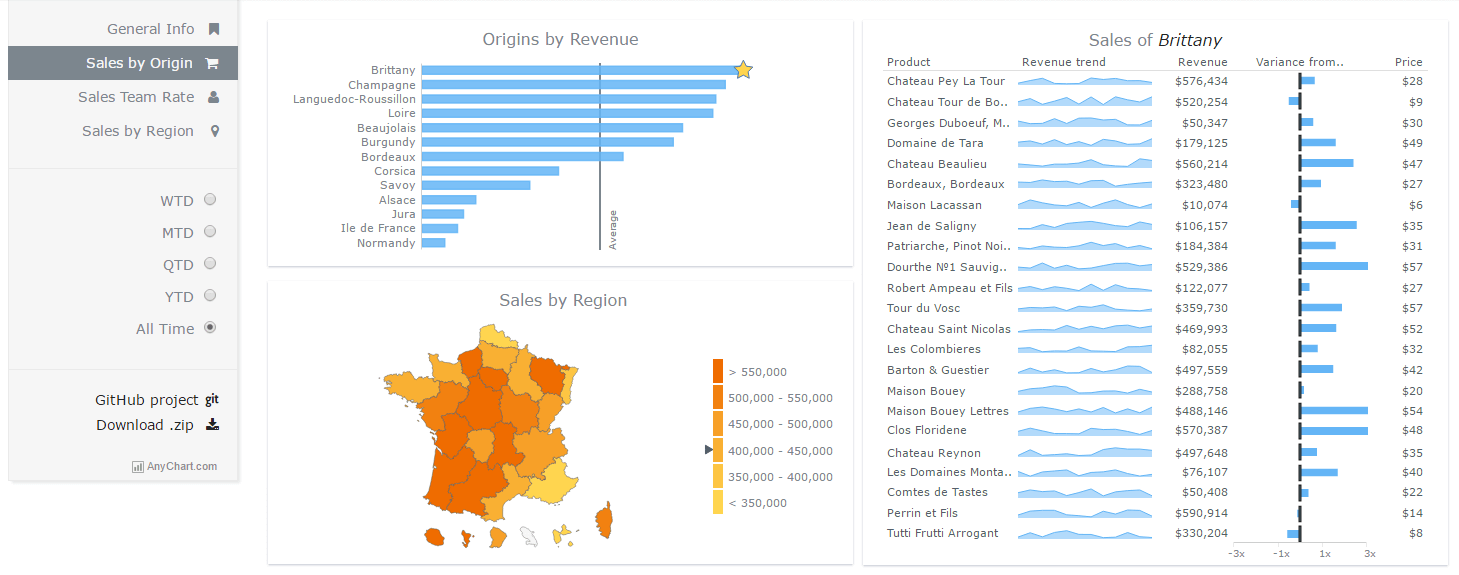
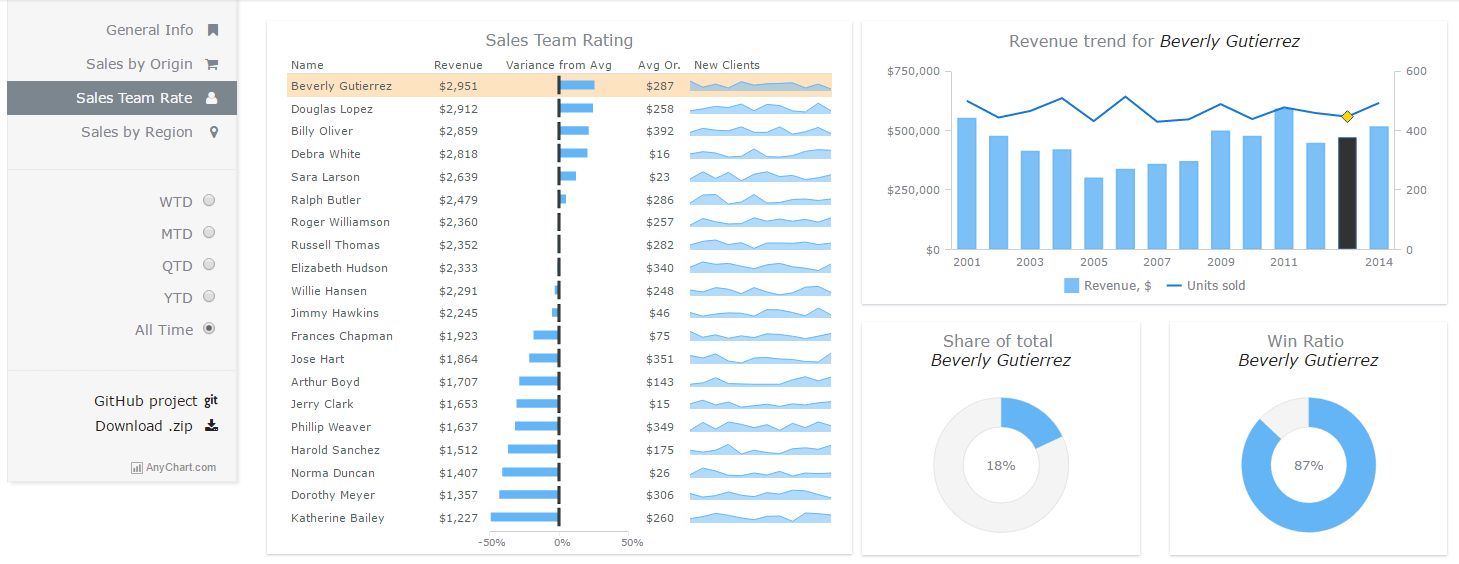
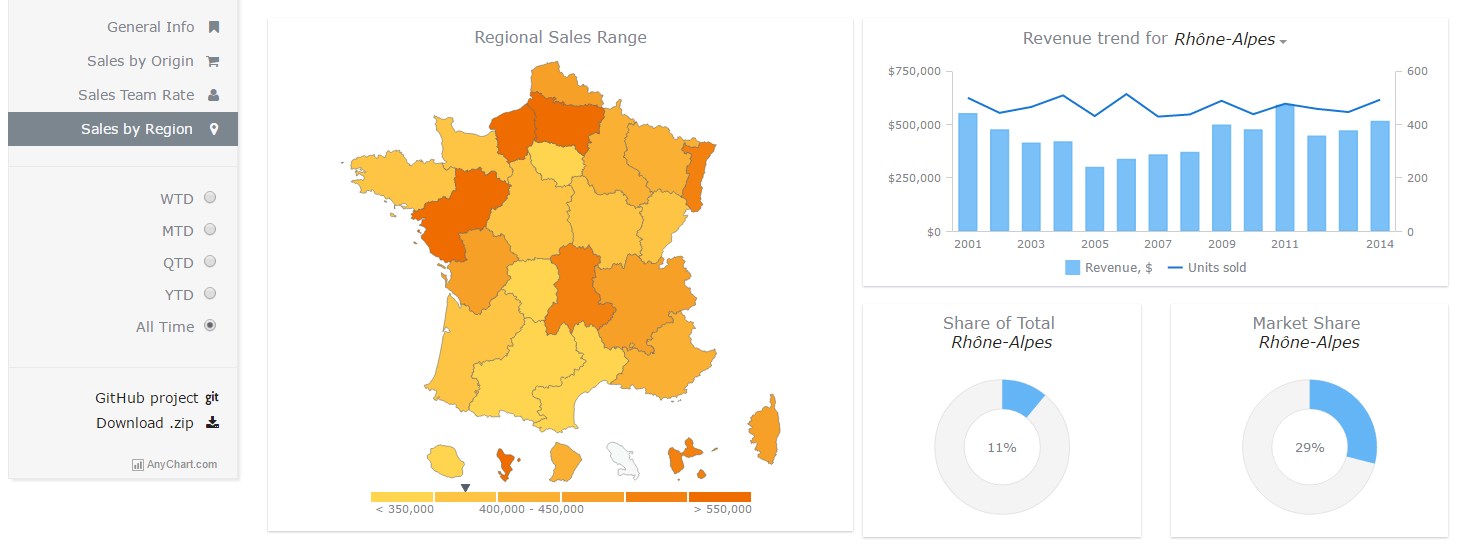
This is an example which covers the basics of any sales dashboard. We did our best to make it visually appealing and easy to grasp.
Example contains four tabs: The first tab - is a general view - it allows to assess the situation as a whole, the other three tabs intend to reveal the situation for particular categories of products, sales team advances and evaluation of sales by region.
The solution is dedicated to the wines of France - a pleasant topic to think about. But don't forget that according to the Surgeon General, women should not drink alcoholic beverages during pregnancy because of the risk of birth defects and that consumption of alcoholic beverages impairs your ability to drive a car or operate machinery, and may cause health problems.
- This Sales Dashboard Demo at AnyChart.Com
- Other Interactive Dashboard Samples at AnyChart.com
- Documentation
- JavaScript API Reference
- Code Playground
- Technical Support
AnyChart Sales Dashboard - Wine Sale in France solution includes two parts:
- Code of the solution that allows to use Javascript library (in this case, AnyChart) to create a dashboard. You can use, edit, modify it, use it with other Javascript libraries without any restrictions. It is released under Apache 2.0 License.
- AnyChart JavaScript library. It is released under Commercial license. You can test this plugin with the trial version of AnyChart. Our trial version is not limited by time and doesn't contain any feature limitations. Check details here.
If you have any questions regarding licensing - please contact us. sales@anychart.com


