AI ROBOT SURFACE DETECTION is an entry to the kaggle competition Help Navigate Robots. In the competition you help robots recognize the floor surface they moving across using only the Inertial Measurement Unit sensor data. There are 9 types of floors including carpet, tiles, concrete, and others.
This project is by Justin Snider and available on GitHub here.
The competition description and datasets used are available on Kaggel here.
Read a step by step explanation of the project in this Jupyter Notebook on Google Colab . In the notebook I will walk you through the process of loading the data, analyzing the data, creating the model, training the model, and evaluating the model's performance.
Below in this README.md you will find a summary of the key findings and results.
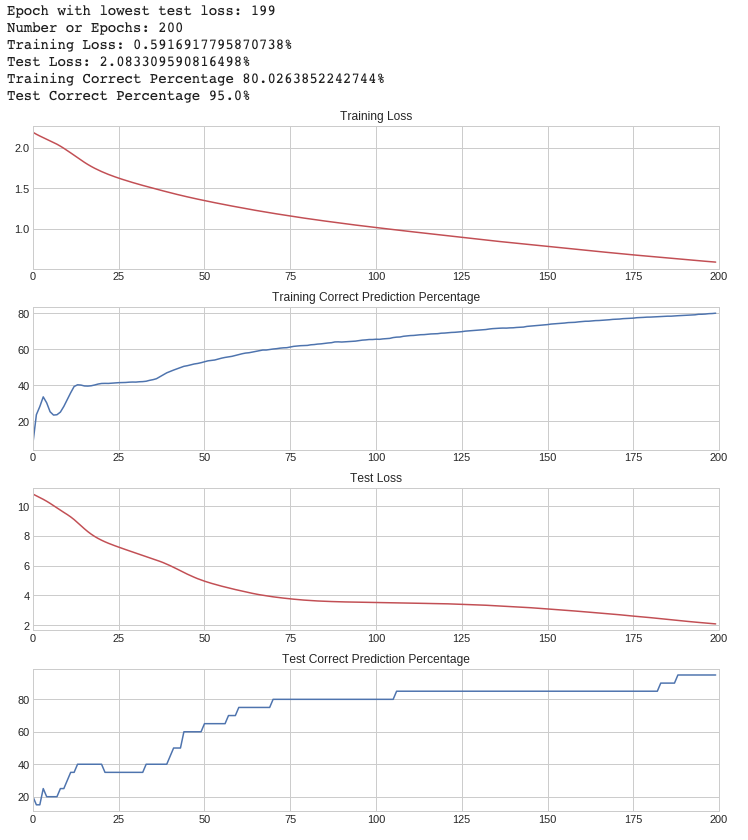
- Epochs: 200
- If we increase the number the model is over trained. The predictions become very bad for any new data.
- If we decrease the number the model does not reach the high point of 95% correct predictions.
- Learning Rate: 0.012
- The learning rate is very important. With a value of 0.012 we are able to get 95% correct predictions. However, anything larger or smaller will peak at a lower correct prediction rate.
- Using typical values and a neural network with less layers and less nodes we originally had a prediction rate of about 80%. We are able to increase this prediction rate to 95% by optimizing the settings.
- Using the original data with no abstracted stats gave a prediction rate of around 50% correct.
- Using instead the stats we abstracted from the raw sequence data boosted our test prediction rate from around 50% up to around 80%.
- There are distinct distributions visible when comparing our stats between materials for all of our attributes.
- However, the large number of attributes suggests we need to use a method with gradient descent, rather than a closed form normal equation.
- The complex overlap between values in the set suggests we will need a relatively complex model rather than a simple one. A neural network would be a good direction to go.
- We use softmax to output our final estimated probability helping us to decide our classification.
- We use the Negative Log Likelihood Loss function
- Use the linear type layer since we have distinct statistics that do not have time based relationships to scan for.
- We use the rectified linear activation function.
- Much of the neural network is standard based on our number of inputs, type of data, and 9 class mutually exclusive classification output.
- We made a few changes that improved the prediction rate.
- We increased the number of hidden layers from 1 to 2.
- Adding 3 or 4 middle layers resulted in overfitting the model so we went back to 2.
- We increased the number of nodes on the hidden layers.
- Increasing the nodes to the maximum number possible resulted in overfitting so we went back to the current settings.
- Together with improving the settings (such as learning rate and epoch count) the updated neural network improved prediction rates on the test set from 80% to 95%.