Problem Statement: How can I find peaks and troughs of a graph? How to find relative error and correlation between two graphs?
Languages: C++
Build Tool: CMake 3.5
Additional Libraries: Boost 1.61.0
Source: https://github.com/apanimesh061/CurveMatcher
Github Page: https://apanimesh061.github.io/projects/curvematcher#part-ii
I will be discussing about the algorithms and techniques that I used to solve the above mentioned problem. I also made a console based application which accepts input from command line and processes them. The full console based project is here.
I tried to make a version of CurveMatcher that runs on Visual Studio 2015 and a GUI interface using Windows Forms. The application has been named FeatureFinder.
Languages: Visual C++
Framework: .Net with Windows Forms
Source: https://github.com/apanimesh061/FeatureFinder
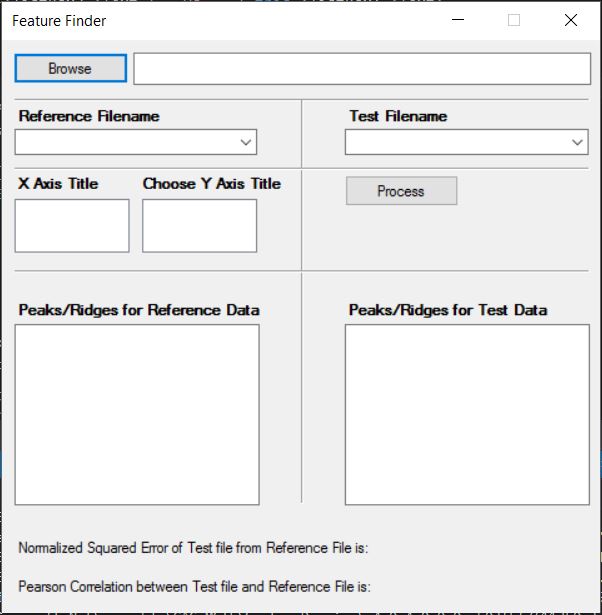
This is how the actual GUI looks like:
| Parts | Description |
|---|---|
| Browse | Helps in choosing the folder |
| Reference Filename | Choose the reference CSV file from dropdown |
| Test Filename | Choose the test CSV file from dropdown |
| X Axis Title | Title of the X-Axis of the graph |
| Choose Y Axis Title | Title of the Y-Axis of the graph |
| Process | Performs the computation |
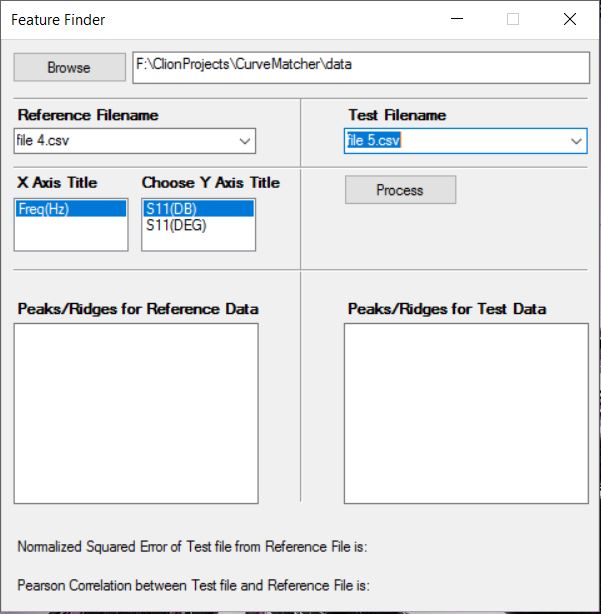
After you choose a folder that has CSV files:
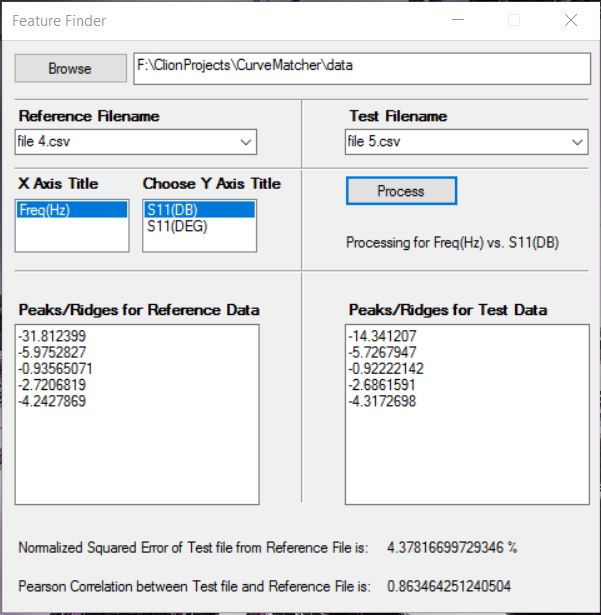
After you click Process:


