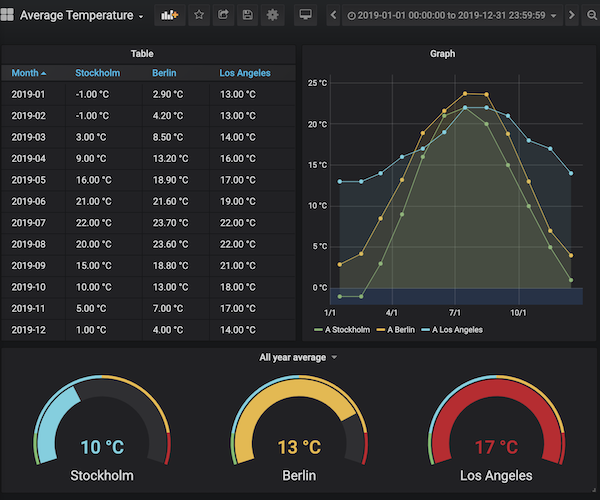
Visualize your Google Spreadsheets with Grafana
Check the docs for information on how to use the data source.
You need to install the following first:
In order to build the plug-in, both front-end and back-end parts, do the following:
yarn install
yarn build
The built plug-in will be in the dist/ directory.
To test the plug-in running inside Grafana, we recommend using our Docker Compose setup:
mage buildAllIn another terminal
docker-compose upTo restart the plug-in after backend changes:
./scripts/restart-plugin.sh
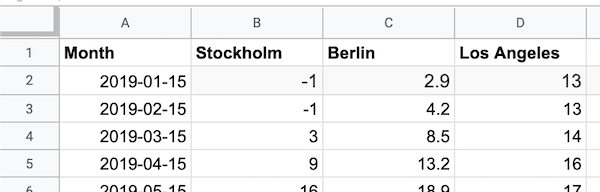
Need at publicly available spreadsheet to play around with? Feel free to use this demo spreadsheet that is suitable for visualization in graphs and in tables.