This project involves training a machine learning model to forecast energy demand.
The data used in this project consists of hourly energy demand data for the years 2020 to 2023 from the UK, from here. The data includes the following features:
SETTLEMENT_DATE: The date and time of the data point. All times are UK time and for the half hour beginning.SETTLEMENT_PERIOD: A number representing the half-hour period of the day. For example, 1 represents the period from 00:00 to 00:30, 2 represents the period from 00:30 to 01:00, and so on.ND: National Demand. All values are an average over the half hour.
Time-based features such as hours of the day or months of the year are inherently cyclic. For instance, after the 12th month (December), the cycle starts again with the 1st month (January). Similarly, after 23:00 hours, the next hour is 00:00. Treating these features as plain numeric values can be misleading for a machine learning model. A model might interpret the jump from 23 to 0 hours or from December to January as a significant change, while in the context of time, they're adjacent values.
To preserve the cyclic nature of these features, we use trigonometric transformations, specifically sine and cosine functions. The idea is to project each hour or month value onto a circle such that the cyclic pattern is captured. For instance, for the hour feature:
-
hour_sin=$(\sin\left(\frac{2\pi \times \text{hour}}{24}\right))$ -
hour_cos=$(\cos\left(\frac{2\pi \times \text{hour}}{24}\right))$
Similarly, for the month feature:
-
month_sin=$(\sin\left(\frac{2\pi \times \text{month}}{12}\right))$ -
month_cos=$(\cos\left(\frac{2\pi \times \text{month}}{12}\right))$
Using this encoding, the difference between December (12) and January (1) or between 23:00 and 00:00 hours becomes minimal, which allows the model to recognize the cyclical patterns in the data better.
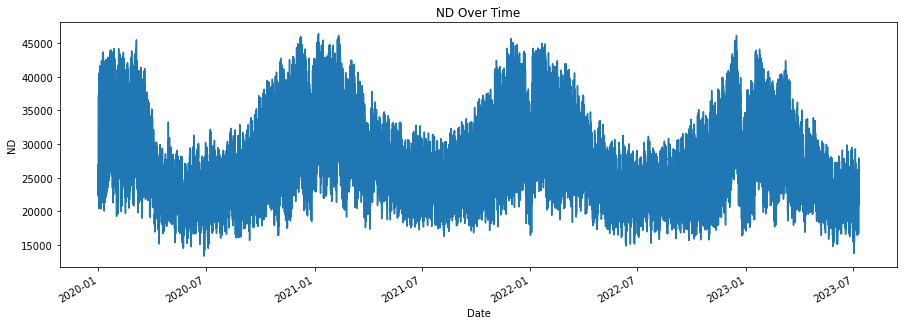
The plot above shows the ND values over time.
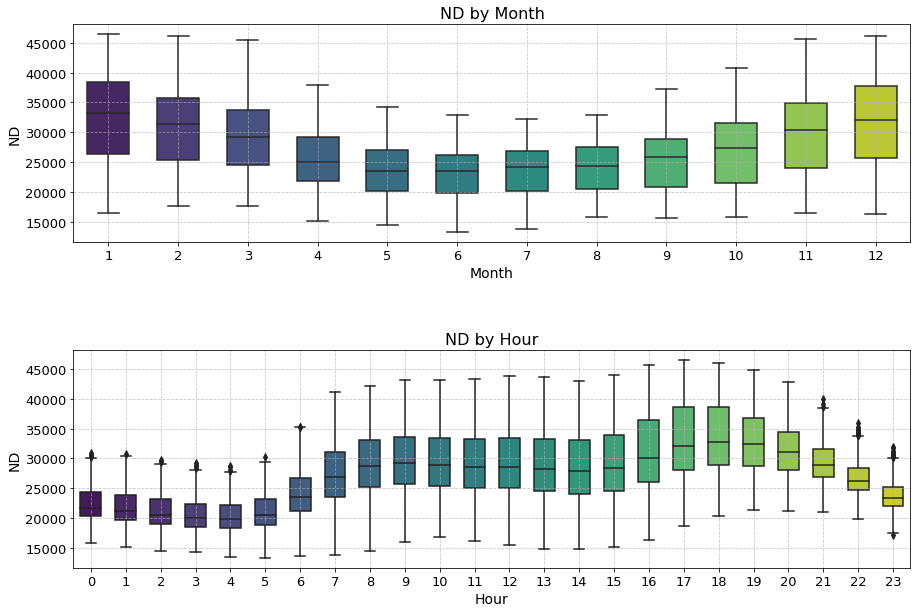
The box plot above shows the distribution of the ND values by month and hour.
The project includes the following files:
project_script.py: A Python script that preprocesses the data, creates time-based features, trains the model, and evaluates its performance.README.md: A README file that explains the project and its components.
The bar plot above shows the importance of each feature used in the model.
To run the project, execute the project_script.py script. This will output the root mean square error (RMSE) of the model on the test set.
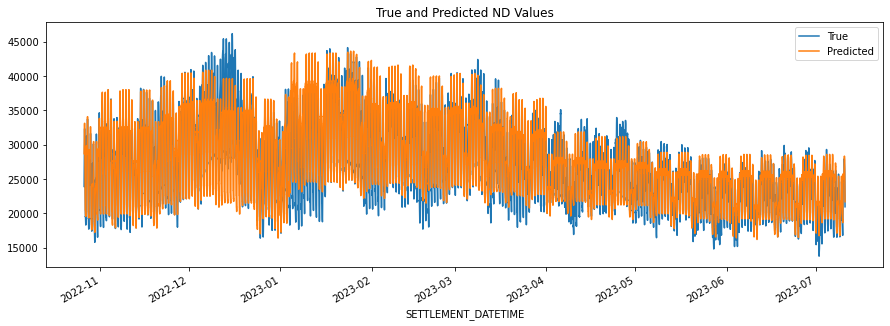
The plot above shows the true and predicted ND values on the test set.
While our current model uses time-based features derived from the SETTLEMENT_DATE, there are several other features that could be used to improve the model's performance in forecasting energy demand:
-
Weather Data: Weather conditions, especially temperature and humidity, can significantly influence energy demand. For example, higher temperatures can increase demand due to the use of air conditioning systems, while lower temperatures can lead to increased heating use. Therefore, incorporating weather data into the model could potentially improve its predictive accuracy.
-
Holiday Indicators: Energy usage patterns can vary on public holidays, weekends, and during specific festive seasons. A binary feature indicating whether a day is a holiday or not could help the model capture these variations.
-
Historical Demand Data: The energy demand in the past hours or days can be indicative of future demand. Incorporating lagged features, i.e., demand values at previous time steps, might improve the model's ability to capture temporal dependencies in the data.
Please note that the addition of these features would require access to the relevant data and might involve substantial preprocessing. Moreover, while these features could potentially improve the model's performance, the actual impact would need to be validated through experimentation.


