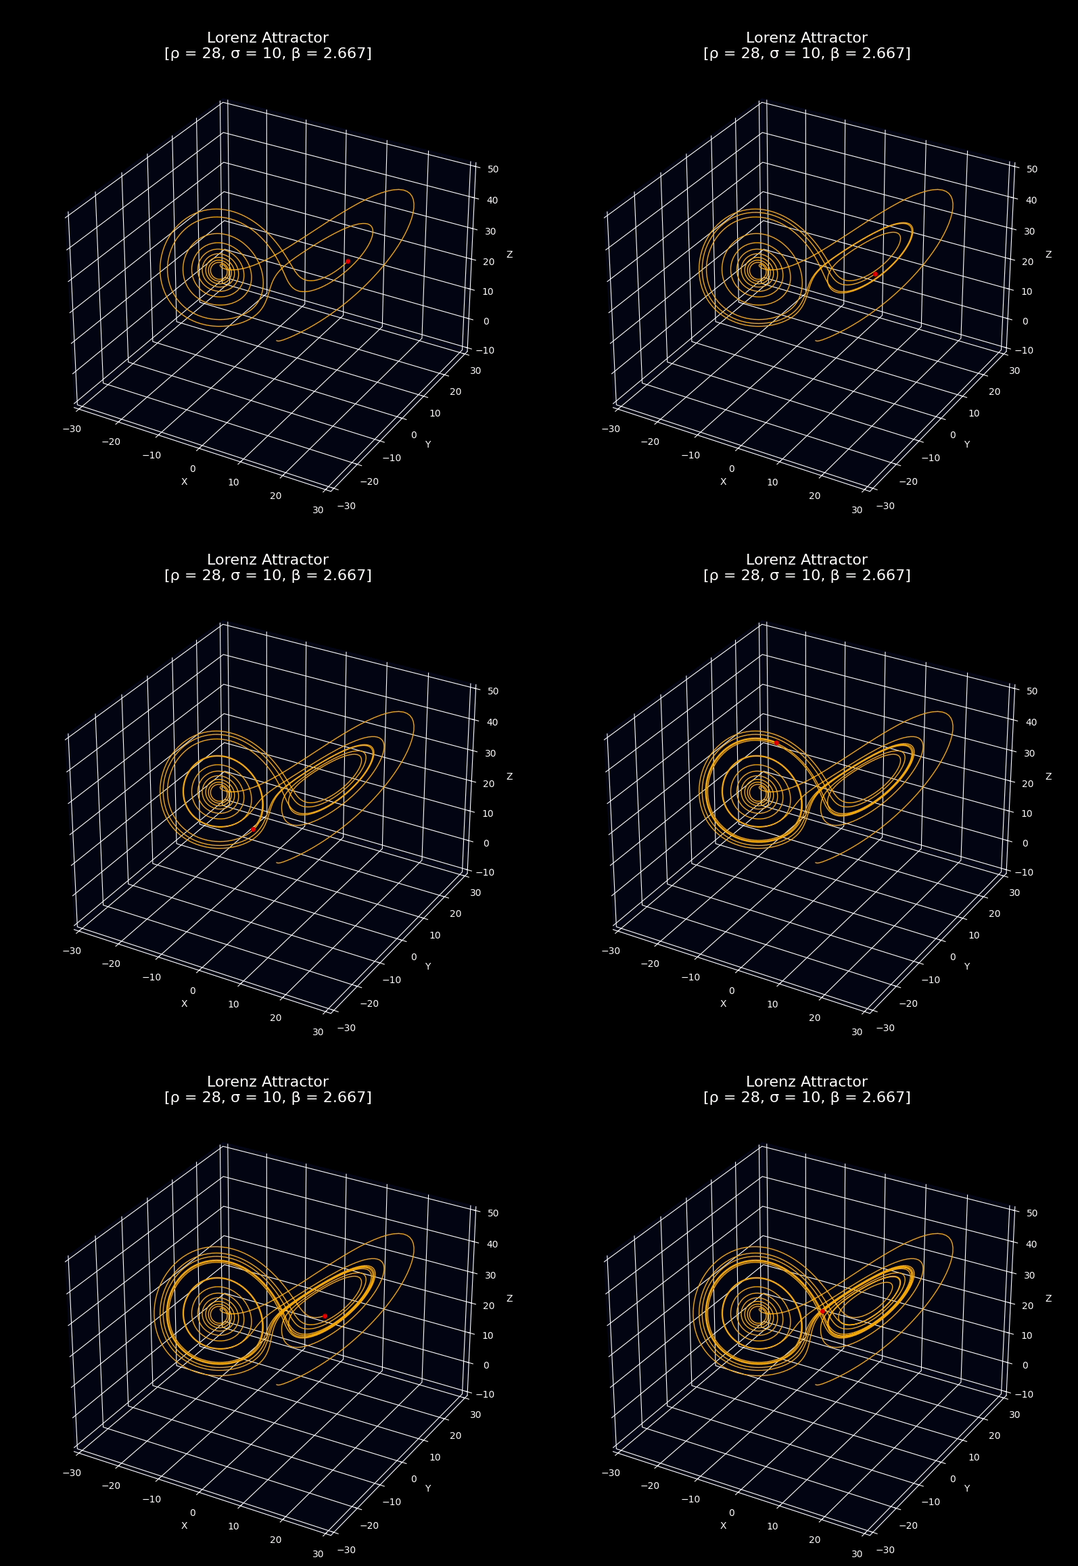
A script to plot, animate, or generate frames for the Lorenz attractor using matplotlib
pipenv install --ignore-pipfile --skip-lock --python 3.9
pipenv shell
If faced by UserWarning: Matplotlib is currently using agg, which is a non-GUI backend, so cannot show the figure.
sudo apt-get install python3.9-tkpython lorenz_attractor.py -h
-h, --help show this help message and exit
-n , --steps Frame/step count to simulate
-r , --ro ρ value of attractor
-s , --sigma σ value of attractor
-b , --beta β value of attractor
-a, --animate Animate flag
-f, --frames Save frames flagpython lorenz_attractor.py -n 5000python lorenz_attractor.py -n 5000 -apython lorenz_attractor.py -n 5000 -f