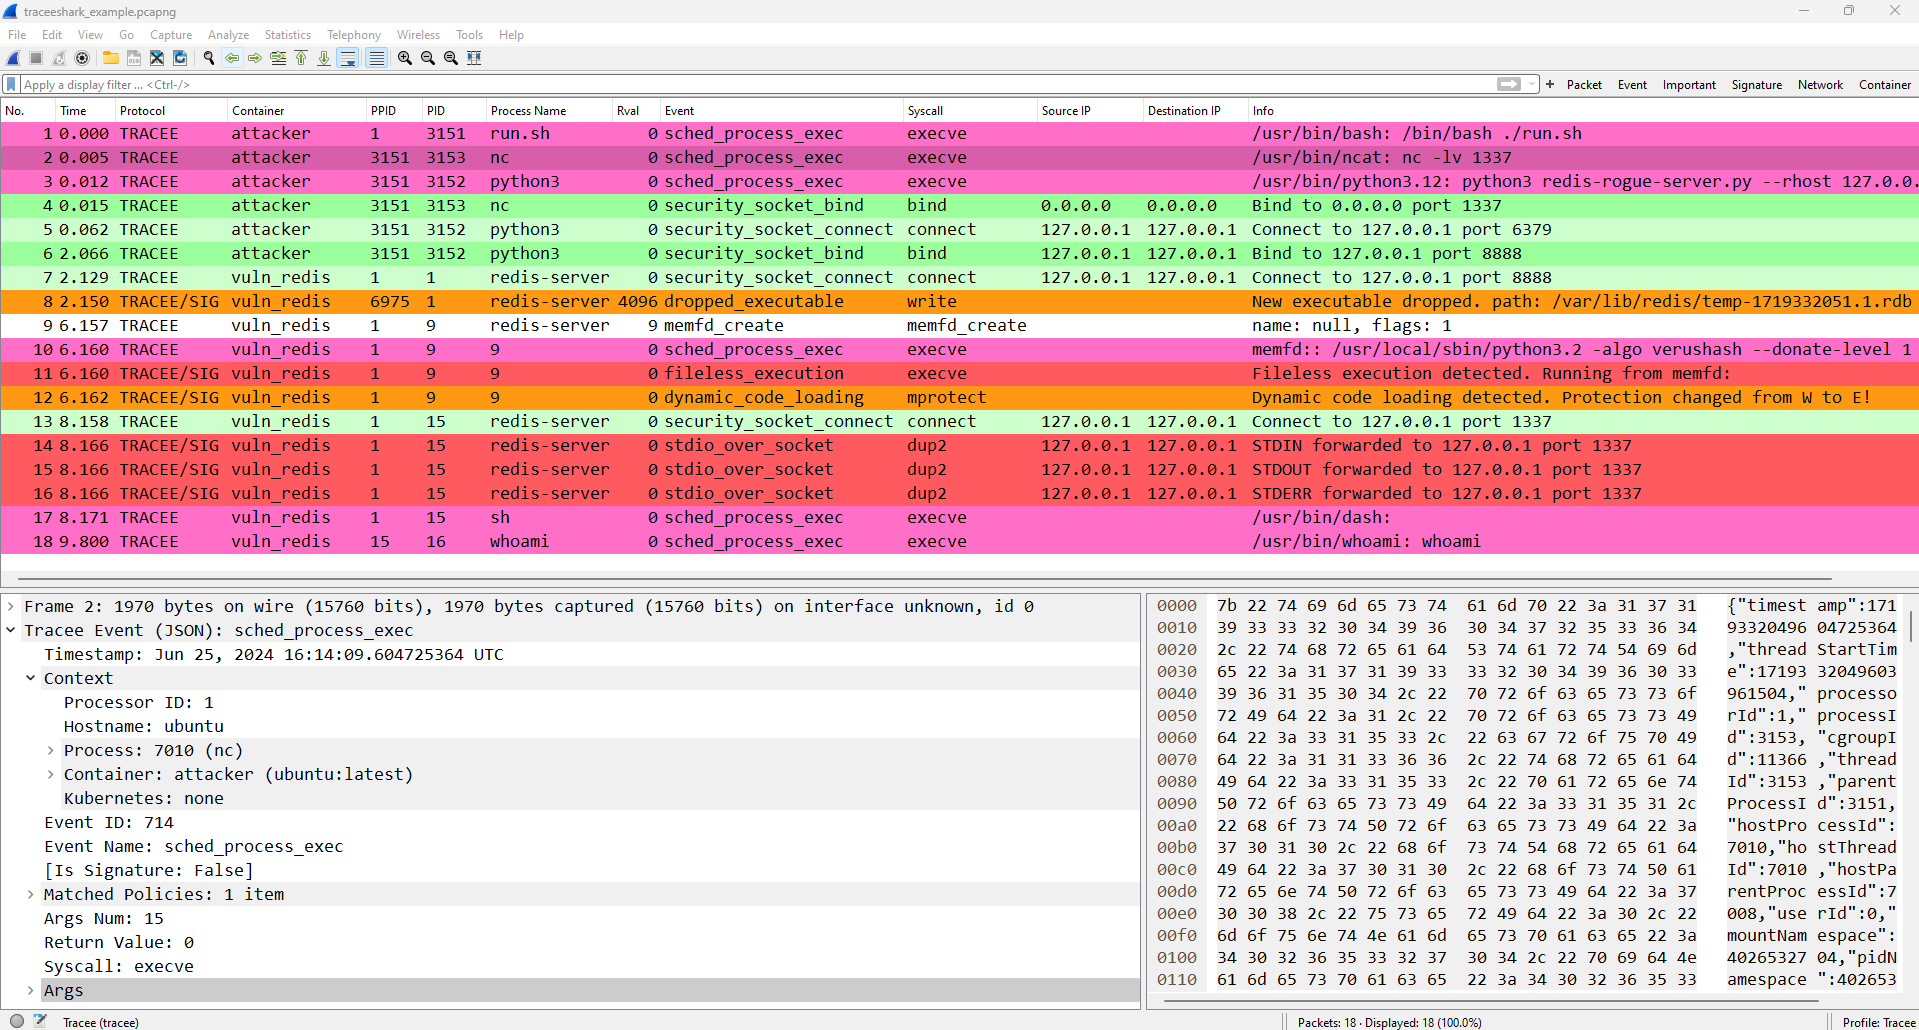
Traceeshark brings the world of Linux runtime security monitoring and advanced system tracing to the familiar and ubiquitous network analysis tool Wireshark.
Using Traceeshark, you can load Tracee captures in JSON format into Wireshark, and analyze them using Wireshark's advanced display and filtering capabilities.
Traceeshark also provides the ability to analyze system events side by side with network packets generated by Tracee that contain rich context about the system process and container they belong to.
Another feature of Traceeshark is the ability to capture events using Tracee directly from Wireshark and have them stream in like a network capture. This can be done either locally on a Linux machine running Wireshark, semi-locally using docker desktop’s VM on Windows and Mac, or even remotely over SSH.
For an overview of Traceeshark and an example of how it can be used for malware analysis, you can read Go deeper: Linux runtime visibility meets Wireshark.
The simplest way to install Traceeshark is using the autoinstall script.
First, make sure you have Python 3 installed, and your Wireshark installation is updated to the latest version.
Then, simply run the following command:
Windows (powershell)
$outFile = [System.IO.Path]::GetTempFileName() ; Invoke-WebRequest -Uri "https://raw.githubusercontent.com/aquasecurity/traceeshark/main/autoinstall.py" -OutFile $outFile ; python.exe $outFile ; rm $outFileLinux/Mac
outfile=$(mktemp) && curl -s "https://raw.githubusercontent.com/aquasecurity/traceeshark/main/autoinstall.py" > $outfile && python3 $outfile && rm $outfileℹ️ Note that Traceeshark is compiled for a specific Wireshark verison. If you are using a Linux distribution with an outdated Wireshark package, the prebuilt releases of Traceeshark may not work. Ubuntu 22.04 and 24.04 have a dedicated release for their Wireshark package version.
To use live capture, Python 3 must be installed and in your PATH, and a few libraries must be installed:
pip3 install paramiko msgpack python-pcapng
Additionally, the user must be able to run docker containers.
ℹ️ This requirement is also applicable to remote servers you want to capture on, make sure the user you log in with can run docker.
On Linux, add your user to the docker group:
sudo usermod -aG docker <user>On Windows and Mac, make sure docker desktop is installed and your user can run containers.
Traceeshark can be installed using a release archive containing the plugins and other required files.
Each release archive targets a specific Wireshark version and may not work with other versions. Download the appropriate release, unzip it, and run the installation script from the command line (install.ps1 on Windows and install.sh on Linux/Mac)
Now the plugins should be available to your Wireshark installation.
To make sure that the plugins were loaded, in Wireshark open Help -> About, select the Plugins tab, and verify that the following 4 plugins are present:
-
tracee-capture -
tracee-event -
tracee-json -
tracee-network-capture
Alternatively, run tshark -G plugins and the plugins should be in the output.
If the tracee-capture plugin does not appear, this means that you haven't set up Python 3 with the correct libraries, see Setup for live capture. If any of the other plugins is not loaded, make sure that the release you installed matches your Wireshark version, and if it does please open an issue.
When using Traceeshark for the first time, the Tracee configuration profile should be applied. The profile defines the custom column view, the event colors and some quick-filter buttons. Go to Edit -> Configuration Profiles... and select the Tracee profile.
After that, any file containing Tracee events in JSON format can be loaded into Wireshark, or the live capture feature can be used to capture Tracee events directly from Wireshark.
If you know how to use Wireshark, using Traceeshark should be natural. If you don't have experience with Wireshark, you can read the User Guide, in particular Chapter 3. User Interface and Chapter 6. Working With Captured Packets are useful.
To use Traceeshark effectively, it is recommended to familiarize yourself with Tracee. If you are only planning to use Traceeshark's live capture feature, there is no need to learn how to use Tracee's command line.
Most of Traceeshark's features are easy to explore by yourself. For a comprehensive explanation about all features, see docs/features.md.
See docs/build.md.


