Deadline: 2021-08-13
- 設計一個多項式函數類別
Polynomial和變數類別Variable,支援以下功能:- 計算多項式函數
- 對多項式函數進行微分
- 實作
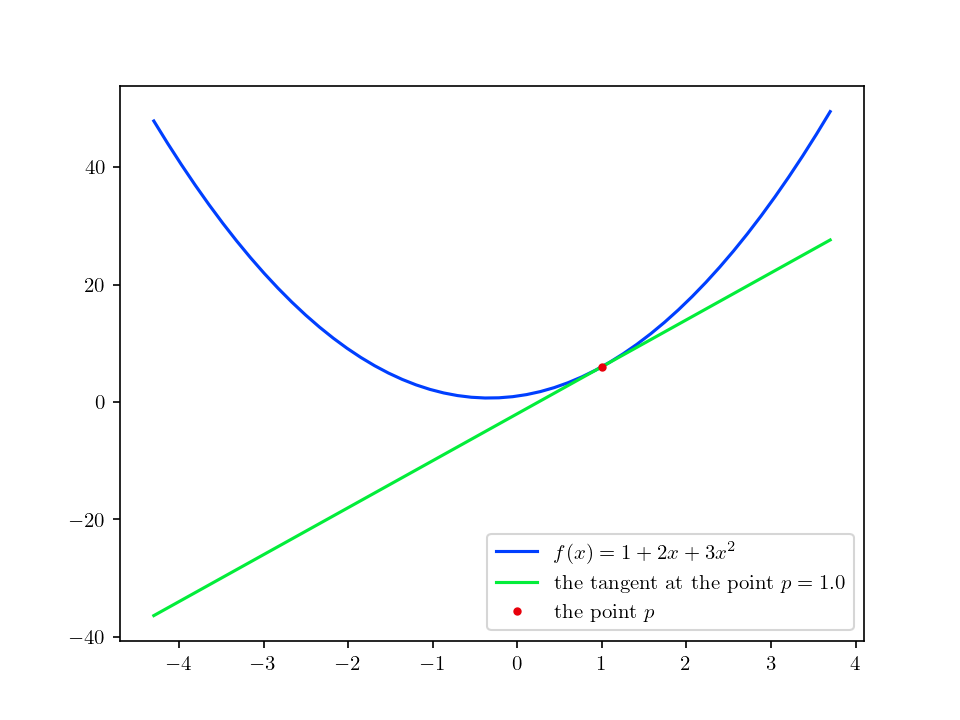
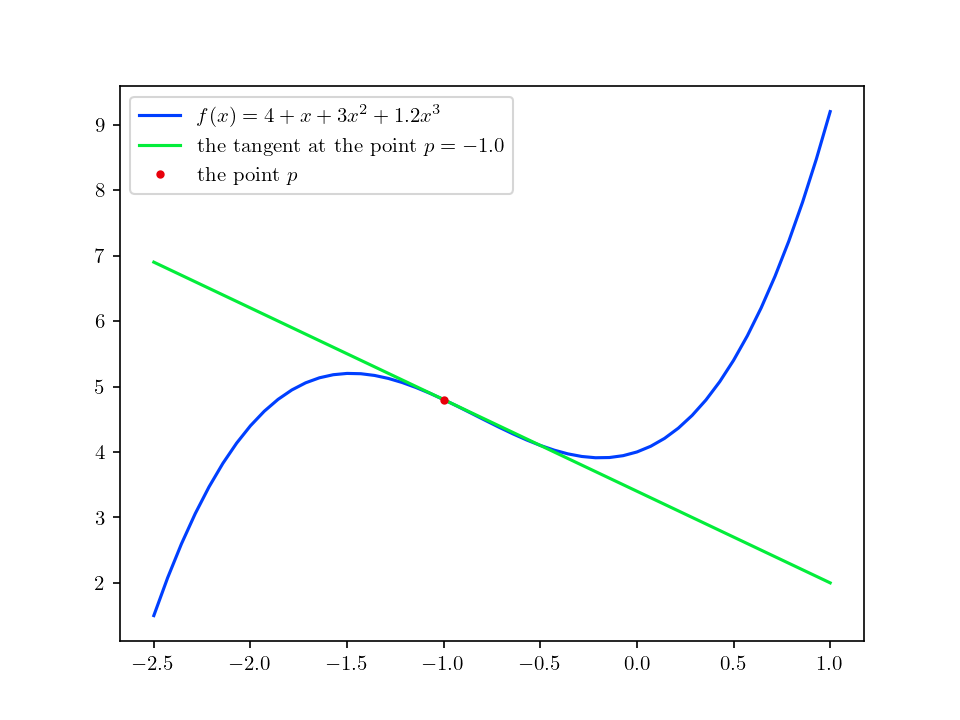
plot_polynomial(file, function, p_x, x, formula),輸出一張 png 檔:- 畫出多項式函數圖形
- 給定一個點,畫出經過該點的多項式函數的切線
- 參數:
file: 輸出的檔案名稱function: 多項式函數的 instancep_x: 點坐標x: 圖表的 x 軸formula: 數學式描述
- NumPy
- Matplotlib
- pytest
In libs/functional.py:
from typing import List, Union

import numpy as np


class Variable:

    def __init__(self, value=None):
        self.value = value
        self.grad = None


class Polynomial:

    def __init__(self, a: List = None):
        self.a = np.array(a)

    def __call__(self, x: Union[float, np.ndarray]) -> Variable:
        pass
In libs/visualization.py:
from pathlib import Path

import numpy as np

from libs.functional import Polynomial
from libs.visualization import plot_polynomial


class TestPlotPolynomial:

    def test_plot_polynomial_1(self):
        f = Polynomial(a=[1., 2., 3.])  # 1 + 2x + 3x^2
        file = Path('test_plot_polynomial_1.png')
        x = np.linspace(-4.3, 3.7)
        plot_polynomial(file=file, function=f, p_x=1., x=x, formula='1 + 2x + 3x^2')
        assert file.exists()

    def test_plot_polynomial_2(self):
        f = Polynomial(a=[4., 1., 3., 1.2])  # 4 + x + 3x^2 + 1.2x^3
        file = Path('test_plot_polynomial_2.png')
        x = np.linspace(-2.5, 1.0)
        plot_polynomial(file=file, function=f, p_x=-1., x=x, formula='4 + x + 3x^2 + 1.2x^3')
assert file.exists()In tests/test_functional.py:
import numpy as np

from libs.functional import Polynomial


class TestPolynomial:

    def test_io(self):
        f = Polynomial(a=[1., 2., 3.])  # 1 + 2x + 3x^2
        assert f(4.).value == 57.
        assert f(5.).value == 86.

    def test_io_array(self):
        f = Polynomial(a=[1., 2., 3.])  # 1 + 2x + 3x^2
        x = np.array([4., 5.])
        y = np.array([57., 86.])
        assert np.all(f(x).value == y)

    def test_grad(self):
        f = Polynomial(a=[1., 2., 3.])  # 1 + 2x + 3x^2
        # gradient: <2 + 6x>
        assert f(4.).grad == 26.
        assert f(5.).grad == 32.
In tests/visualization.py:
from pathlib import Path

import numpy as np

from libs.functional import Polynomial
from libs.visualization import plot_polynomial


class TestPlotPolynomial:

    def test_plot_polynomial_1(self):
        f = Polynomial(a=[1., 2., 3.])  # 1 + 2x + 3x^2
        file = Path('test_plot_polynomial_1.png')
        x = np.linspace(-4.3, 3.7)
        plot_polynomial(file=file, function=f, p_x=1., x=x, formula='1 + 2x + 3x^2')
        assert file.exists()

    def test_plot_polynomial_2(self):
        f = Polynomial(a=[4., 1., 3., 1.2])  # 4 + x + 3x^2 + 1.2x^3
        file = Path('test_plot_polynomial_2.png')
        x = np.linspace(-2.5, 1.0)
        plot_polynomial(file=file, function=f, p_x=-1., x=x, formula='4 + x + 3x^2 + 1.2x^3')
assert file.exists()test_plot_polynomial_1.png:
test_plot_polynomial_2.png:
Deadline: 2021-08-20
給定 data
point
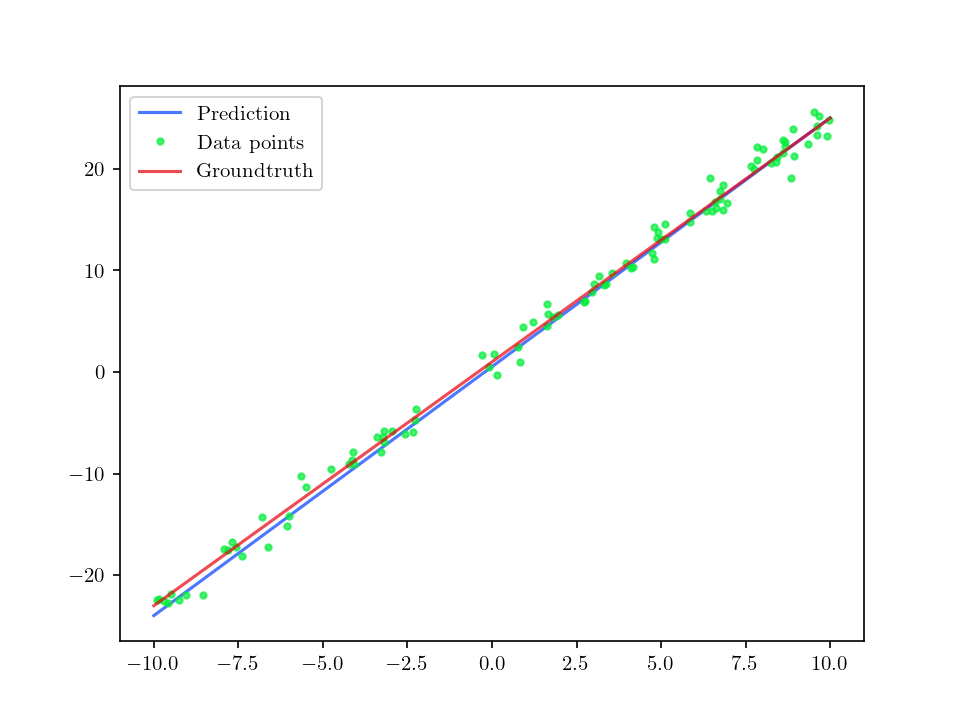
,利用 SGD 解出 linear regression.
In libs/functional.py:
from typing import Tuple

import numpy as np


def regression_sgd(x, y, num_samples, num_iterations, batch_size, learning_rate) -> Tuple[np.ndarray, np.ndarray]:
    pass
In libs/visualization.py:
def plot_regression(file, x, y, prediction, groundtruth):
passIn tests/test_functional.py:
import numpy as np

from libs.functional import regression_sgd


def test_regression_solved_correctly():
    m_gt, b_gt = 2.4, 1.0
    num_samples = 100
    x = np.random.uniform(-10, 10, num_samples)
    noise = np.random.normal(0, 1, num_samples)
    y = m_gt * x + b_gt + noise
    num_iterations = 1000
    batch_size = 10
    learning_rate = 0.001

    m, b = regression_sgd(x, y, num_samples, num_iterations, batch_size, learning_rate)

    assert m.shape == (num_iterations + 1,) and b.shape == (num_iterations + 1,)
    assert np.isclose(m[-1], m_gt, 1e-01)
In tests/visualization.py:
from pathlib import Path

import numpy as np

from libs.functional import regression_sgd
from libs.visualization import plot_regression


def test_plot_regression():
    m_gt, b_gt = 2.4, 1.0
    num_samples = 100
    x = np.random.uniform(-10, 10, num_samples)
    noise = np.random.normal(0, 1, num_samples)
    y = m_gt * x + b_gt + noise
    num_iterations = 1000
    batch_size = 10
    learning_rate = 0.001

    m, b = regression_sgd(x, y, num_samples, num_iterations, batch_size, learning_rate)
    file = Path('test_plot_regression.png')
    plot_regression(file, x, y, prediction=(m, b), groundtruth=(m_gt, b_gt))

    assert file.exists()

