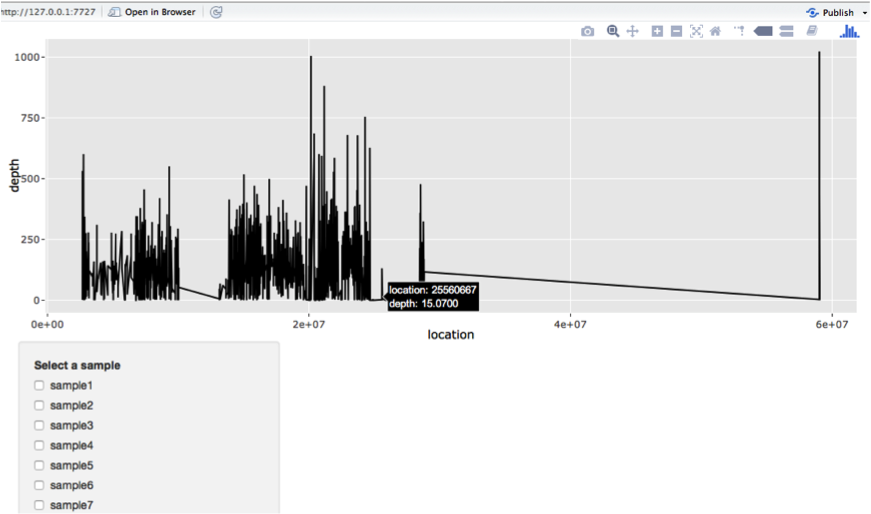
Results include:
- PPT presentation, report in .html
- code in .Rmd
- a Rshiny app for interactive visualization, show values on hover
open runShiny.R and follow instruction
Aneuploidy is defined as presence of an abnormal number of chromosomes in a cell. We perform this test as part of our fertility panel.
We provided data of two batches (batch_1, batch_2) that include a number of samples with this abnormality. The objective of this data challenge is to estimate the number of X and Y chromosomes for each sample.
Each batch includes two files:
Depth:
This file has the average depth of each interval for each sample.
Interval_order:
This file has chromosome, start and end of the intervals in ‘Depth.csv’. The order of the rows in ‘Interval_order.csv’ file is the same as the order of the rows in ‘Depth.csv’ file in a given batch. Note that chromosomes X and Y are indexed as 23 and 24, respectively.
