💡 This POC is closed and learnings are available as of Arcus Web API v1.4.0.
POC to integrate Azure API Management with our observability based on Request-Id according W3C Trace-Context.
Before you can run this, you need to:
- Provision an Azure API Management instance with a self-hosted gateway
- Configure the gateway in Docker Compose
- Create a Bacon API based on the OpenAPI spec of our local API (url)
- Make Bacon API available locally
- Run solution with Docker Compose
- Get bacon by calling the self-hosted gateway - GET http://localhost:700/market/bacon/api/v1/bacon
- Ensure to add the
X-API-Keyheader with your subscription key
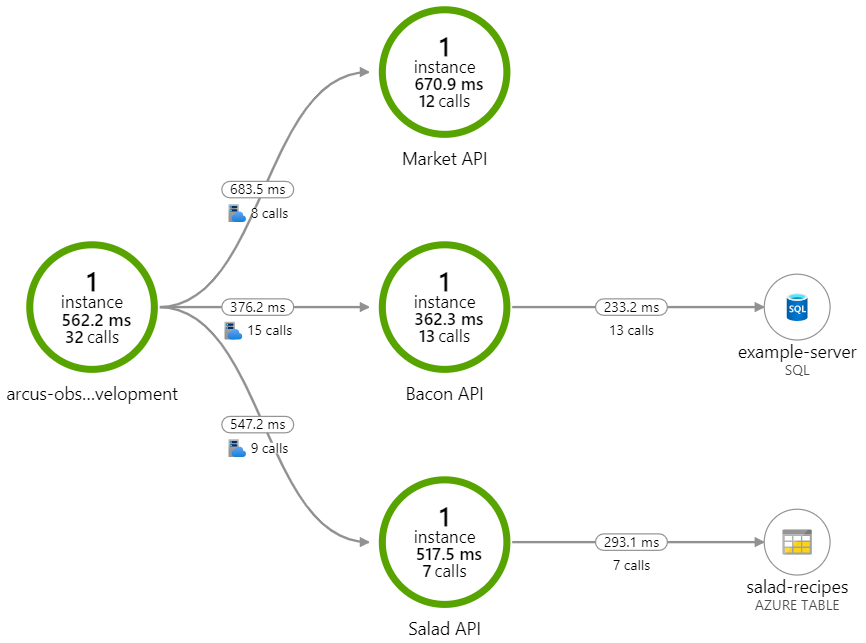
End-to-end correlation from Azure API Management is provided until the database:
- Be more open and extensible in Arcus (Arcus #143)
- Incorporate hacks upstream to be able to interpret, track and use parent id
- Incorporate hacks upstream allowing users to re-use upstream service operation id and tracking them correspondingly
- Provide support for tracking parent operation IDs, based on the guidance (docs, see below)
Some of the action items can be easily found by searching for TODO: Contribute Upstream or using the Task List.
- Should we generate ID's according to W3C (
System.Diagnostics.Activity)?- Tracked in arcus-azure/arcus.webapi#248
- Why are the correlation options part of Arcus Observability if they are scoped to Web APIs?
- This is required for our Serilog stack
Doing end-to-end correlation across multiple components and back is not in scope.
This needs to be improved in Arcus and probably should extend this POC or start a new one.
As per the guidance:
Application Insights defines a data model for distributed telemetry correlation. To associate telemetry with a logical operation, every telemetry item has a context field called
operation_Id. This identifier is shared by every telemetry item in the distributed trace. So even if you lose telemetry from a single layer, you can still associate telemetry reported by other components.A distributed logical operation typically consists of a set of smaller operations that are requests processed by one of the components. These operations are defined by request telemetry. Every request telemetry item has its own
idthat identifies it uniquely and globally. And all telemetry items (such as traces and exceptions) that are associated with the request should set theoperation_parentIdto the value of the requestid.Every outgoing operation, such as an HTTP call to another component, is represented by dependency telemetry. Dependency telemetry also defines its own
idthat's globally unique. Request telemetry, initiated by this dependency call, uses thisidas itsoperation_parentId.You can build a view of the distributed logical operation by using
operation_Id,operation_parentId, andrequest.idwithdependency.id. These fields also define the causality order of telemetry calls.
This means that we are handling the operation ID (aka operation_Id) correctly today, but we need to:
- Provide tracking of parent IDs for operations (aka
operation_ParentId) - Keep track of the unique IDs for request telemetry items, to use as parent ID for other telemetry
- Keep track of the unique IDs for dependency telemetry items, to use as parent ID for other telemetry
Learn more in this example.

