Plot.Core
Cross-Platform Chart Generation Library for .NET Core.
I couldn't find a chart rendering library to run under .NET Core (specifically for, but not limited to, AWS Lambda), so I created this one.
Usage:
let series =
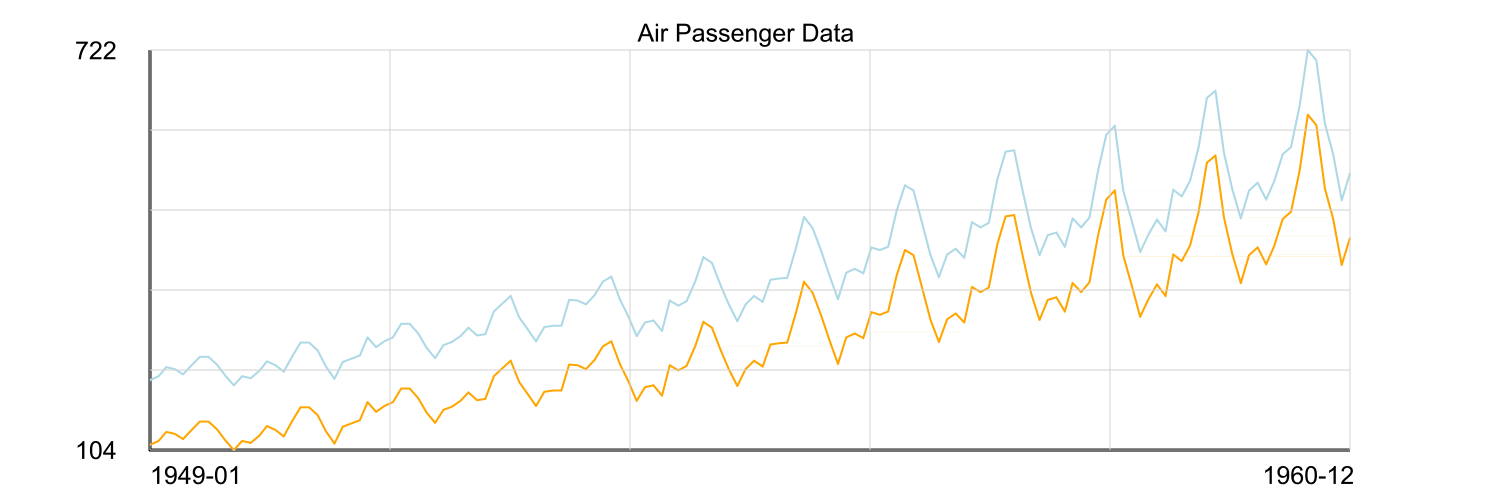
{ originalPoints = Plot.Core.FakeData.monthlyDataDateTimes
title = "Air Passenger Data"
lineStyle =
{ Color = Rgba32.Orange
Thickness = 2.f }}
let inflatedSeries =
{ originalPoints = Plot.Core.FakeData.monthlyDataDateTimes |> Array.map(fun op -> { op with y = op.y + 100. })
title = "Inflated Air Passenger Data"
lineStyle =
{ Color = Rgba32.LightBlue
Thickness = 2.f }}
let settings = Settings.createLineChartSettings "Air Passenger Data Jan 49 – Dec 60" 1500 500
match [series; inflatedSeries] |> createLineChart settings with
| Some image -> image.Save "AirPassengerData.png"
| None -> failwith "Something went wrong."
And results look like:
The rendering settings can be customized by updating the Settings record from the code above, before passing to createLineChart. The Settings record has the structure:
open SixLabors.ImageSharp

type LineChartSettings = {
    Title               : string
    Width               : int
    Height              : int
    Font                : SixLabors.Fonts.Font
    GridLineStyle       : LineStyle
    MinorGridLineStyle  : LineStyle
    HorizontalGridLines : int option
    VerticalGridLines   : int option
}