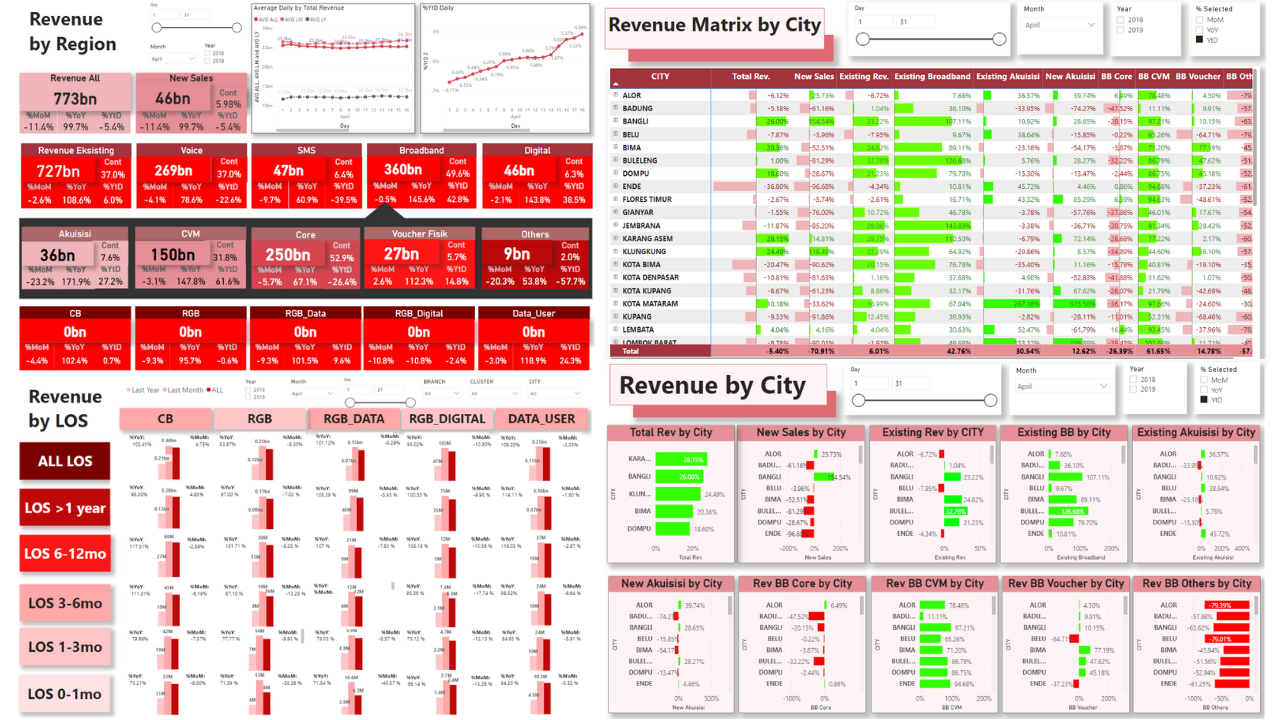
This is my project during internship at PT Telekomunikasi Selular (Telkomsel), January 2022-March 2022. After cleaning the dummy dataset using Python and Microsoft Excel, my team and I constructed a comprehensive Region Dashboard which consisted of Region Dashboard, Branch/City Dashboard, Revenue Driver Matrix, and Revenue Driver Bar Chart. The entirety of this dashboard suite was constructed utilizing Microsoft Power BI.
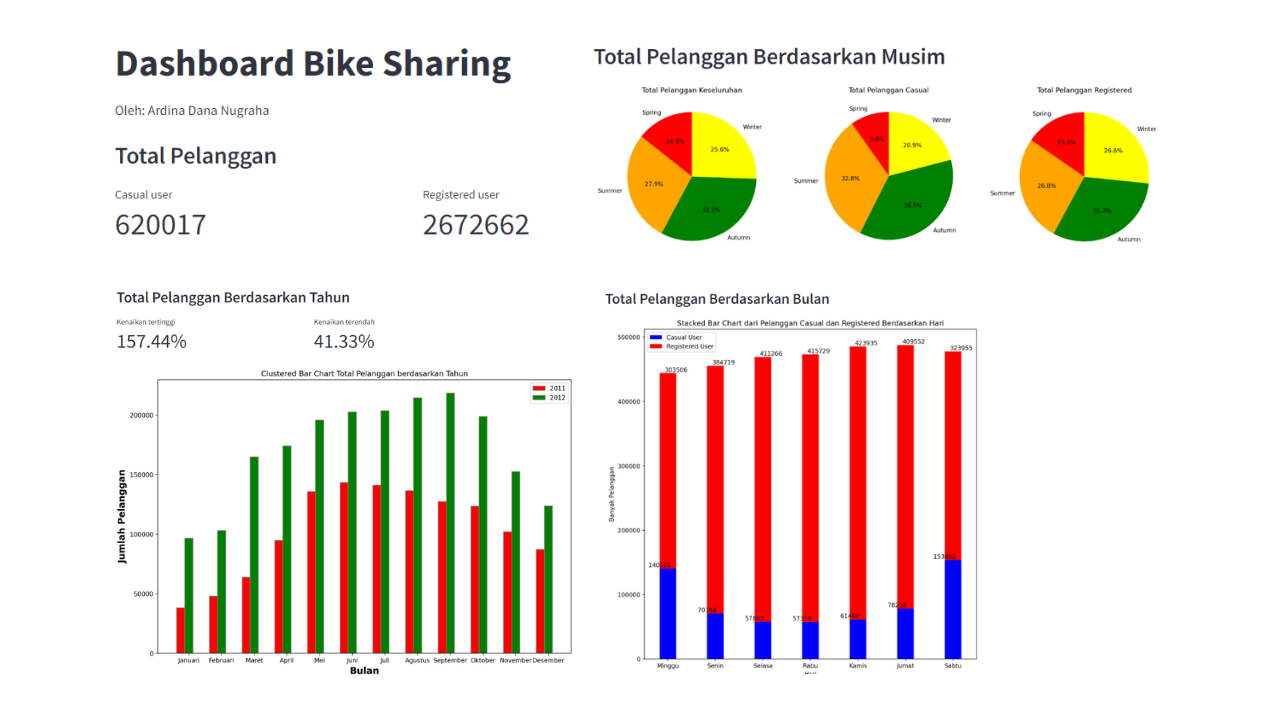
A bike sharing dashboard was constructed using Python with streamlit library. The development process encompassed essential stages, including data wrangling, data cleaning, Exploratory Data Analysis (EDA), and the creation of insightful data visualizations.
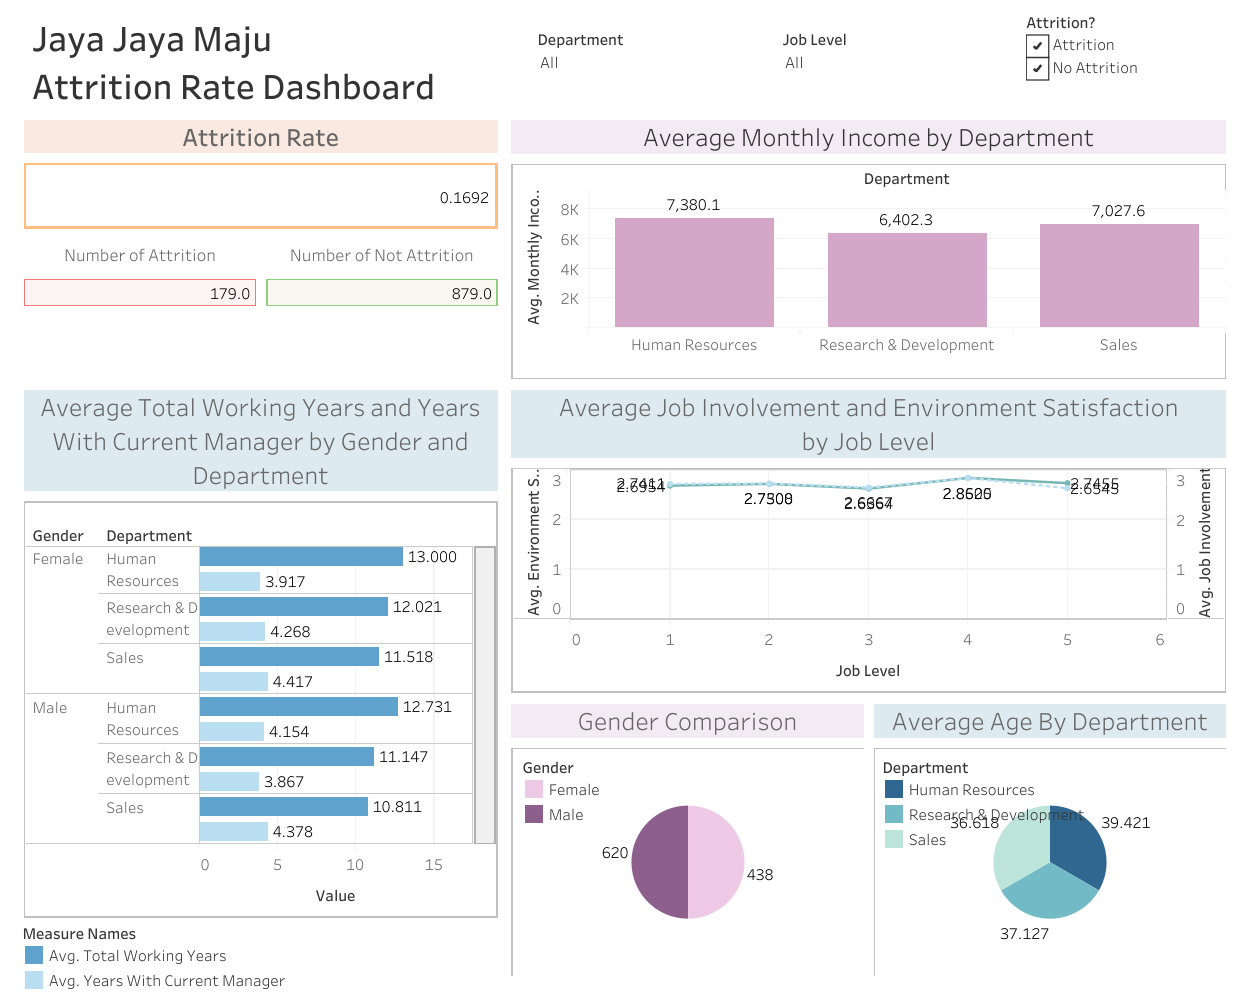
This is my submission during data science learning path in ID Camp. An attrition rate dashboard for virtual company, Jaya Jaya Maju, was developed utilizing Tableau. The dashboard suggests that the company should provide guidance and evaluation for job level 1 (such as ensuring that facilities are provided appropriately and ensuring that the employees adapt and feel comfortable within the company), allocate a greater portion of job involvement at job level 5, investigate the Sales department (which may include surveys, personal interviews with employees, or evaluations, followed by devising solutions to address identified issues), and reevaluate department managers, especially Human Resources, to monitor their performance.
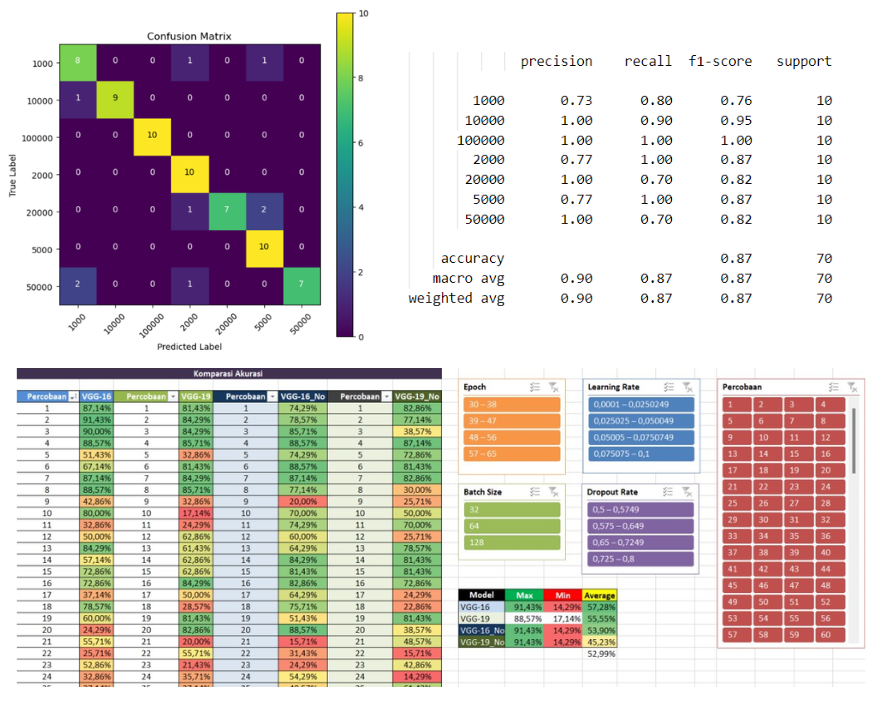
This project combined various hyperparameters: epoch, batch size, learning rate, dropout rate. The scanned dataset consisted of normal, scuffed, dirty, torn, and blurred 2016 and 2022 emision years banknotes. This study showed that VGG-16 with image processing gave the best results with the highest accuracy of 91.43%. VGG-16 with image processing gives the best average accuracy of 57.28%. VGG-19 with image processing followed with an average accuracy of 55.55%, followed by VGG-16 without image processing at 53.90%, and VGG-19 without image processing at 45.23%.
- Image processing:
- Image Enhancement: Histogram Equalization
- Image segmentation: Otsu Method
- Classification: VGG-16 and VGG-19 model
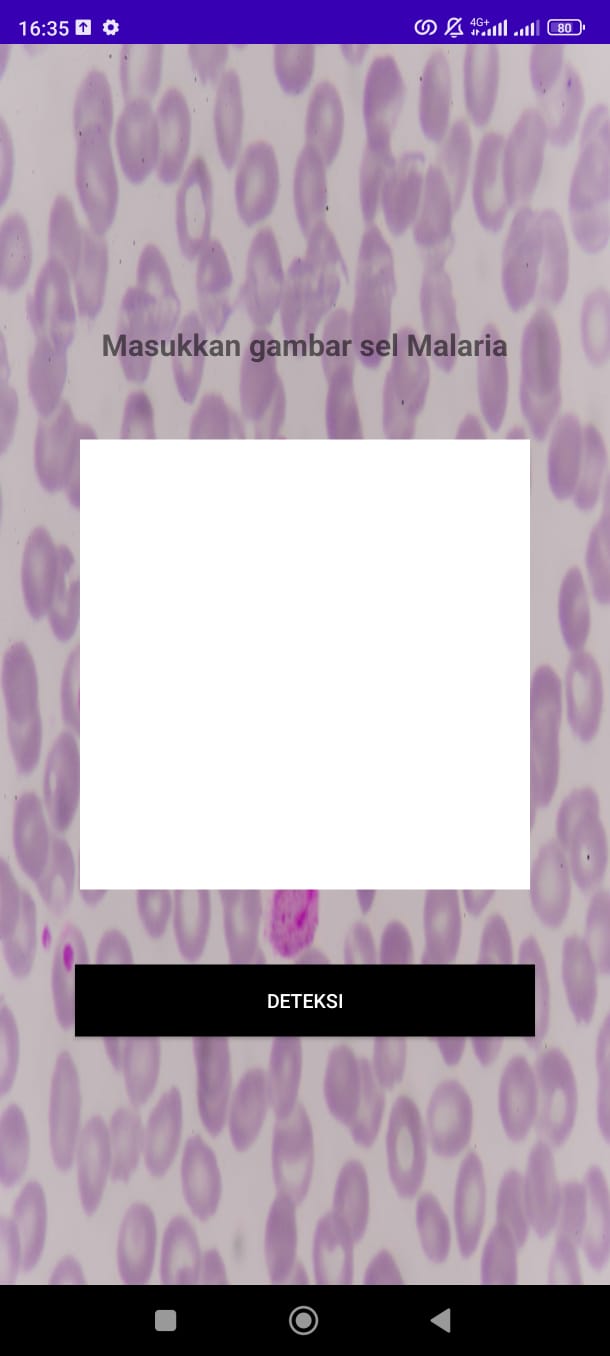
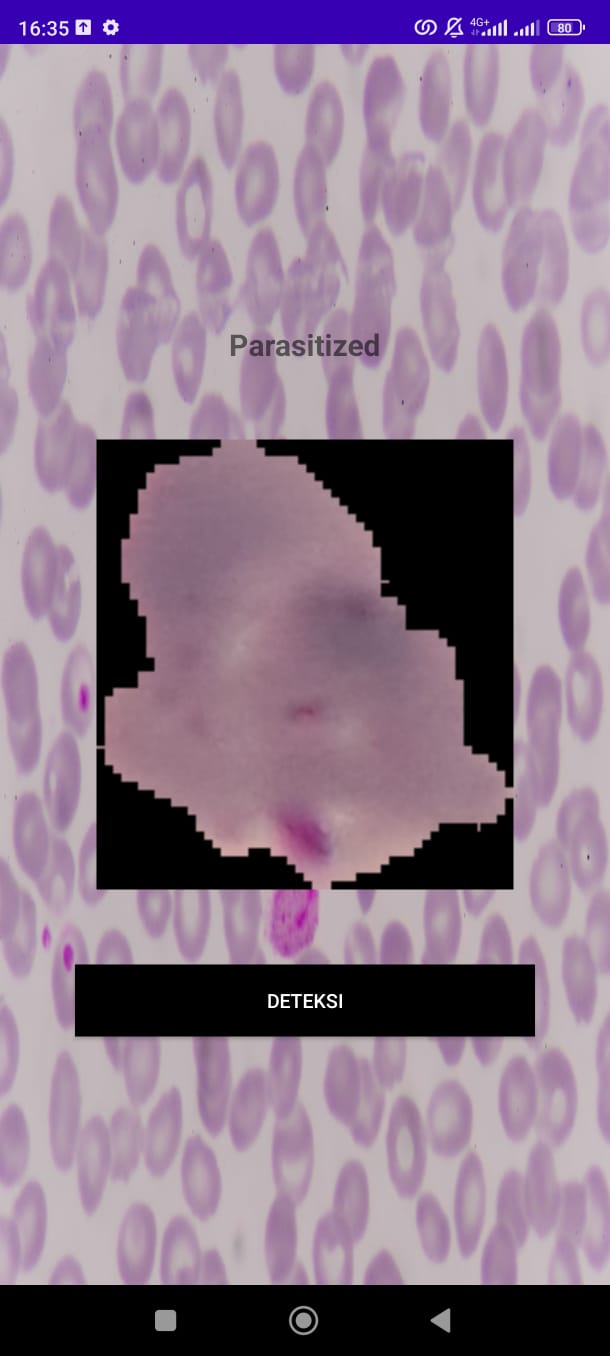
Malaria Cell Classification aimed to classify malaria into two classes: Infected and Uninfected. Method used was Convolutional Neural Network (CNN).The model is saved as .tflite and deployed as apk.
This project used text dataset comprising records of patient consultations with their doctor. Sastrawi Stemmer were applied due to the dataset being in Bahasa Indonesia. Elbow method showed that the optimal k = 5. Consequently, the dataset was partitioned into 25 clusters based on the optimal k-value.
In this project, emotion classification encompassing joy, anger, and fear was undertaken. A sequential model consisting a Long Short-Term Memory (LSTM) network was constructed. The model achieved an impressive accuracy of 99.16%, with a validation accuracy of 92.17% recorded at the ninth epoch.
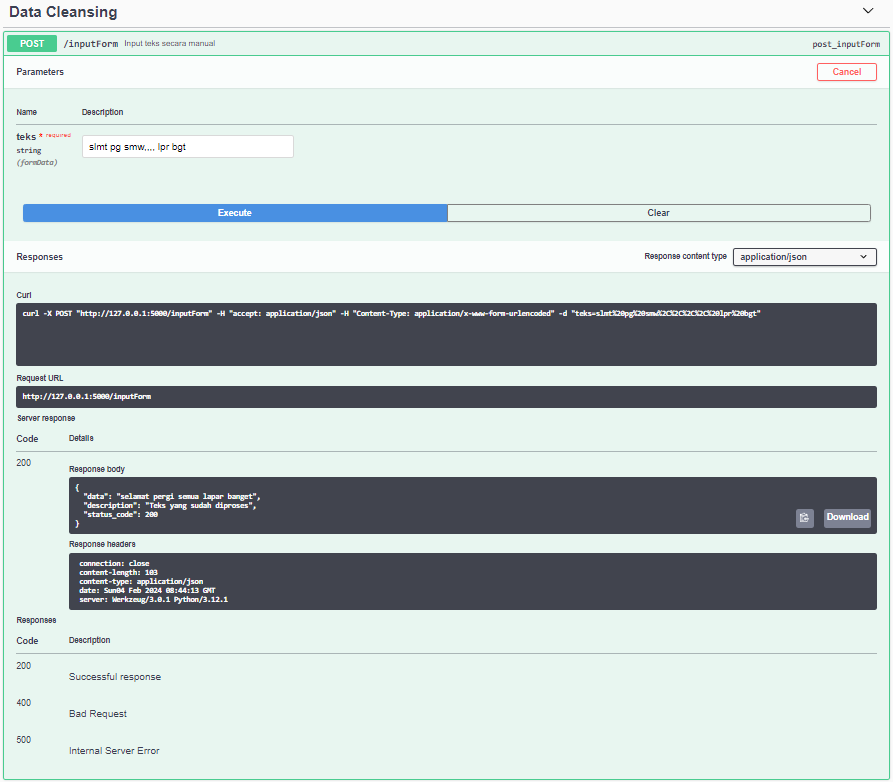
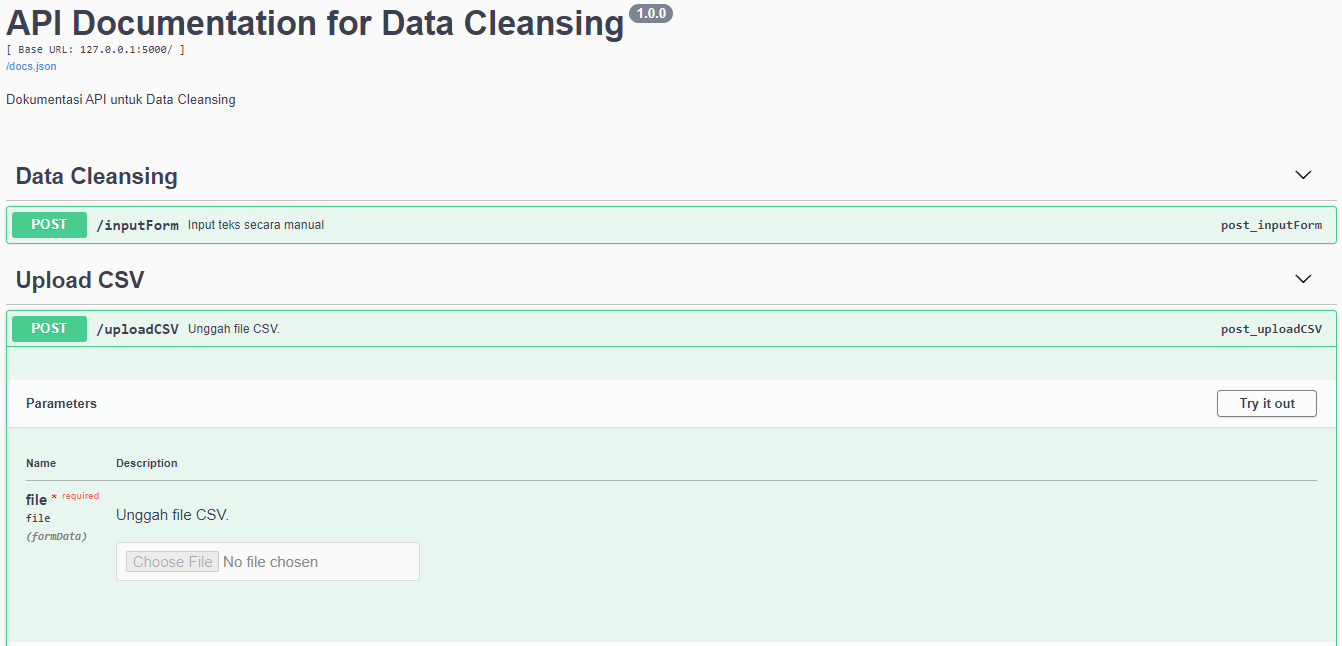
Data Cleanser is an API made using Flasgger. It aimed to cleanse data (specifically X or Twitter data), such as removing punctuations and removing whitespace. After being cleansed, the data will be visualized through pie chart, bar chart, and wordcloud to help user gain insights.
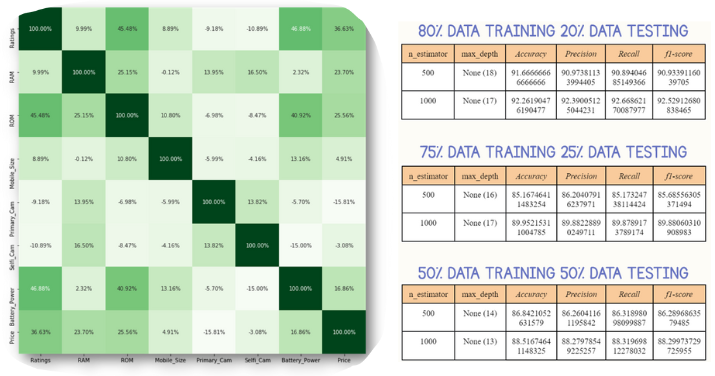
This project used random forest method with Python. The workflow involved initial data preprocessing, followed by Exploratory Data Analysis (EDA), Feature Selection, and the application of the Random Forest algorithm. Multiple ratios for splitting the dataset were experimented with during the analysis. The project revealed that the most optimal ratio for splitting the dataset was determined to be 80:20.
This project used genetic algorithm to ascertain the optimal route of ice tube delivery. Steps conducted in this project are initialization, population selection, modelling, evaluation and regeneration, and elitism. The entire process was executed utilizing Matlab as the primary tool.
© 2023 Ardina Dana Nugraha. Powered by Jekyll and the Minimal Theme.

