The GitHub datasource allows GitHub API data to be visually represented in Grafana dashboards.
- Releases
- Commits
- Repositories
- Issues
- Organizations
- Labels
- Milestones
- Response Caching
- Deploys
- Visualize queries
- Template variables
- Annotations
Caching on this plugin is always enabled.
Options:
| Setting | Required |
|---|---|
| Access token | true |
| Default Organization | false |
| Default Repository | true |
To create a new Access Token, navigate to Personal Access Tokens and create a click "Generate new token."
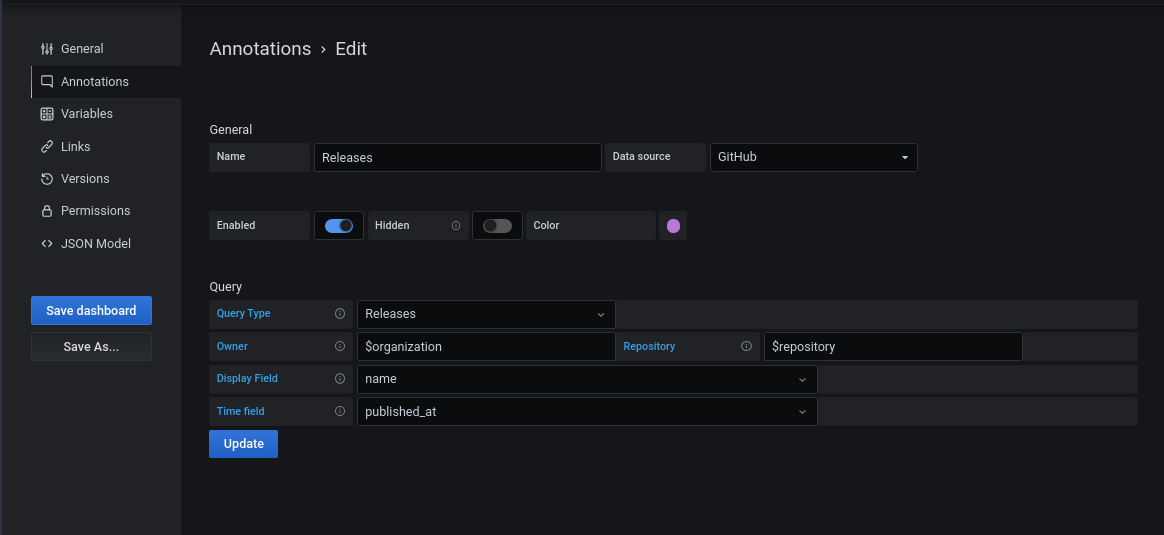
Annotations overlay events on a graph.
With annotations, you can display:
- Commits
- Issues
- Pull Requests
- Releases
- Tags
on a graph.
All annotations require that you select a field to display on the annotation, and a field that represents the time that the event occured.
Work in progress
Variables allow you to substitute values in a panel with pre-defined values.
For all repositories:
-
public_repo -
repo:status -
repo_deployment -
read:packages -
user:read -
user:email
An extra setting is required for private repositories
repo (Full control of private repositories)
- I am using GitHub OAuth on Grafana. Can my users make requests with their individual GitHub accounts instead of a shared
access_token?
No. This requires changes in Grafana first. See this issue in the Grafana project.
- Why does it sometimes take up to 5 minutes for my new pull request / new issue / new commit to show up?
We have aggressive caching enabled due to GitHub's rate limiting policies. When selecting a time range like "Last hour", a combination of the queries for each panel and the time range is cached temporarily.
- I am trying to use a template variable in the "Query" field and it's not working
Template variables are currently not supported outside of the "Owner / Organization" and "Repository" fields.
- Why are there two selection options for Pull Requests and Issue times when creating annotations?
There are two times that affect an annotation:
- The time range of the dashboard or panel
- The time that should be used to display the event on the graph
The first selection is used to filter the events that display on the graph. For example, if you select "closed at", only events that were "closed" in your dashboard's time range will be displayed on the graph.
The second selection is used to determine where on the graph the event should be displayed.
Typically these will be the same, however there are some cases where you may want them to be different.

