- Debugging on Linux (x64 or ARM), macOS and Windows*,
- Conditional breakpoints, function breakpoints, data breakpoints, logpoints,
- Launch debuggee in integrated or external terminal,
- Disassembly view with instruction-level stepping,
- Loaded modules view,
- Python scripting,
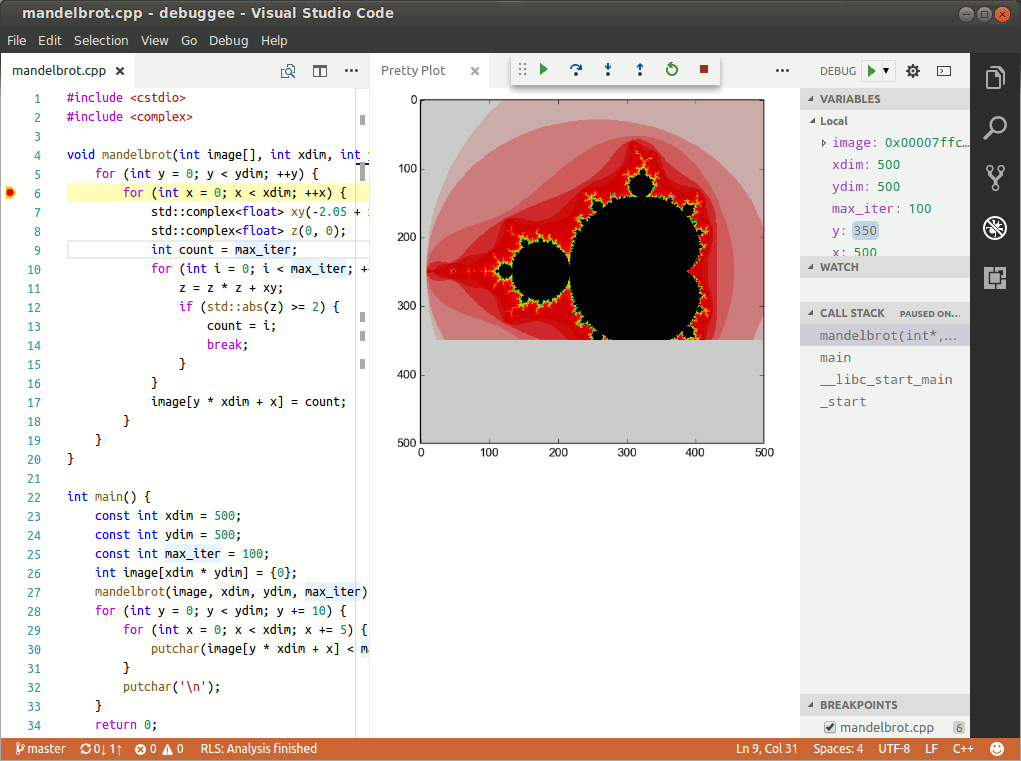
- HTML rendering for advanced visualizations,
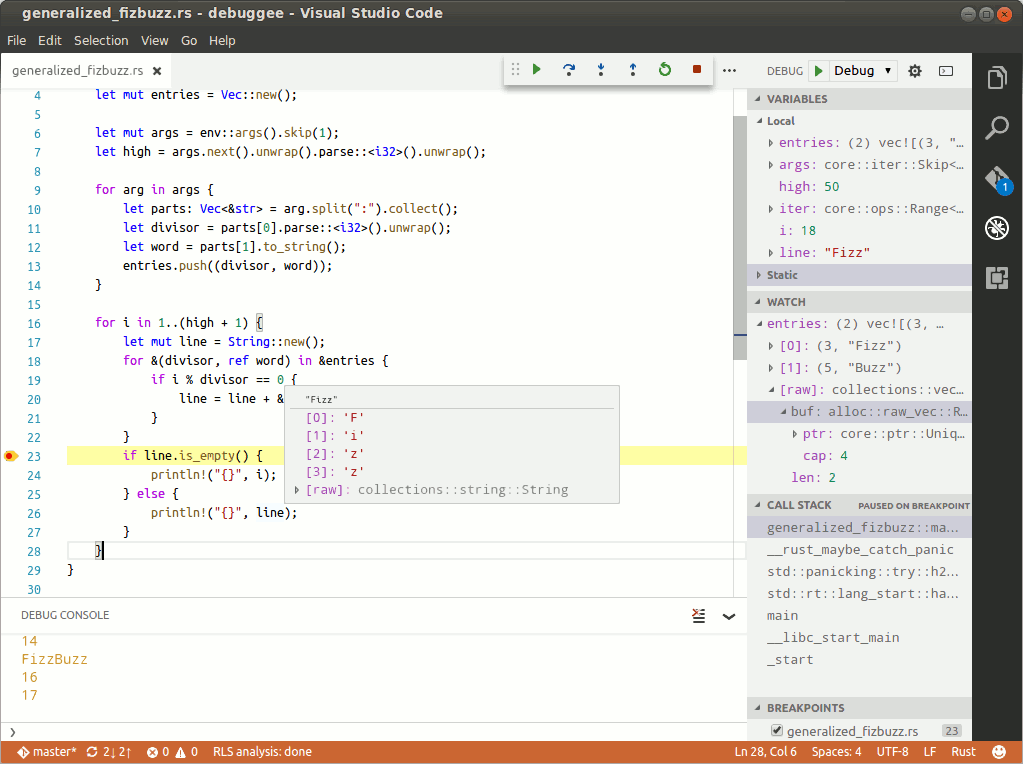
- Rust language support with built-in visualizars for vectors, strings and other standard types,
- Global and workspace defaults for launch configurations,
- Remote debugging,
- Reverse debugging (experimental, requires compatible backend).
* DWARF debug info format recommended, limited support for MS PDB.
For full details please see the User's Manual.
- 64-bit OS
- Linux: glibc 2.18 (Debian 8, Ubuntu 14.04, Centos 8)
- Mac: OS X 10.10 Yosemite
- Windows: 10.0
- 64-bit Python 3.5 (optional, except on Windows).
Here's a minimal debug configuration to get you started:
{
    "name": "Launch",
    "type": "lldb",
    "request": "launch",
    "program": "${workspaceFolder}/<my program>",
    "args": ["-arg1", "-arg2"],
}- Initial Setup
- Debugging in VS Code - if you are new to VSCode debugging.
- CodeLLDB User's Manual - about this specific extension.
- Troubleshooting - known problems and solutions.
- Q & A - for when you are stuck.
C++ debugging with data visualization (Howto):

Rust debugging:
