- Description
- Objectives
- Local setup
- Security
- Using IPython
- Using cProfile
- Using pstats
- Using SnakeViz
- Using kernprof and line_profiler
- Using memory_profiler
- Using mprof and matplot
- Using pytest-benchmark
- License
Understanding how to optimise Python by following the course https://www.linkedin.com/learning/faster-python-code/.
- Rules of optimization
- Measuring time
- Using line_profiler
- Picking the right data structure
- Using the bisect module
- Memory allocation in Python
- Caching, cheating, and parallel computing
- NumPy, Numba, and Cython
- Design and code reviews
- Install python 3: https://www.python.org/downloads/.
- Create and activate a virtual environment, then install project dependencies:
python3 -m venv ~/.python-envs/optimizing-python source ~/.python-envs/optimizing-python/bin/activate (optimizing-python) ➜ make install - Configure the IDE Interpreter to use the virtual environment as project interpreter.
- Setup the run configuration in the IDE if needed: https://www.jetbrains.com/help/pycharm/creating-and-editing-run-debug-configurations.html?keymap=secondary_macos.
Command for running security checks on installed dependencies:
make security
This is an example of trying out a timeit calculation using the IPython Notebook. To load the code we use the "run" magic method. The "-n" tells run not to run the main part of the code, just to load the functions in the file. Here with use_catch we gain around 20% speed-up (167/206 = 0.8106796116504854).
(optimizing-python) ➜ ipython
Python 3.8.3 (v3.8.3:6f8c8320e9, May 13 2020, 16:29:34)
Type 'copyright', 'credits' or 'license' for more information
IPython 7.15.0 -- An enhanced Interactive Python. Type '?' for help.

In [1]: %run -n src/using_timeit.py

In [2]: %timeit use_get('a')
206 ns ± 9.75 ns per loop (mean ± std. dev. of 7 runs, 1000000 loops each)

In [3]: %timeit use_catch('a')
167 ns ± 5.37 ns per loop (mean ± std. dev. of 7 runs, 10000000 loops each)
This is an example of how to profile using prun in IPython.
By default prun sorts the results by time.
To view what options we have we can do %prun?
(optimizing-python) ➜  optimizing-python git:(master) ✗ ipython
Python 3.8.3 (v3.8.3:6f8c8320e9, May 13 2020, 16:29:34)
Type 'copyright', 'credits' or 'license' for more information
IPython 7.15.0 -- An enhanced Interactive Python. Type '?' for help.

In [1]: %run -n src/prof.py

In [2]: cases = list(gen_cases(1000))

In [3]: %prun bench_login(cases)

         8936 function calls in 0.033 seconds

   Ordered by: internal time

   ncalls  tottime  percall  cumtime  percall filename:lineno(function)
     1000    0.017    0.000    0.017    0.000 {method 'execute' of 'sqlite3.Cursor' objects}
      983    0.005    0.000    0.005    0.000 {built-in method _crypt.crypt}
     1000    0.004    0.000    0.004    0.000 {method 'fetchone' of 'sqlite3.Cursor' objects}
     1000    0.002    0.000    0.024    0.000 login.py:12(user_passwd)
     1000    0.002    0.000    0.033    0.000 login.py:30(login)
     1000    0.001    0.000    0.001    0.000 {method 'cursor' of 'sqlite3.Connection' objects}
:


In [4]: %prun -s cumulative bench_login(cases)

         8936 function calls in 0.031 seconds

   Ordered by: cumulative time

   ncalls  tottime  percall  cumtime  percall filename:lineno(function)
        1    0.000    0.000    0.031    0.031 {built-in method builtins.exec}
        1    0.000    0.000    0.031    0.031 <string>:1(<module>)
        1    0.001    0.001    0.031    0.031 prof.py:22(bench_login)
     1000    0.001    0.000    0.030    0.000 login.py:30(login)
     1000    0.002    0.000    0.022    0.000 login.py:12(user_passwd)
     1000    0.016    0.000    0.016    0.000 {method 'execute' of 'sqlite3.Cursor' objects}
This is an example of how to use the line_profiler in IPython. In this case, we'll use line_profiler to get a more detail profiling of the login function in particular.
(optimizing-python) ➜ ipython
Python 3.8.3 (v3.8.3:6f8c8320e9, May 13 2020, 16:29:34)
Type 'copyright', 'credits' or 'license' for more information
IPython 7.15.0 -- An enhanced Interactive Python. Type '?' for help.

In [1]: %run -n src/prof.py

In [2]: cases = list(gen_cases(1000))

In [3]: %load_ext line_profiler

In [4]: %lprun -f login bench_login(cases)
Timer unit: 1e-06 s

Total time: 0.03381 s
File: <...>/optimizing-python/src/login.py
Function: login at line 31

Line #      Hits         Time  Per Hit   % Time  Line Contents
==============================================================
    31                                           def login(user, passwd):
    32                                               """Return True is user/passwd pair matches"""
    33      1000        485.0      0.5      1.4      try:
    34      1000      25466.0     25.5     75.3          db_passwd = user_passwd(user)
    35        21         19.0      0.9      0.1      except KeyError:
    36        21         22.0      1.0      0.1          return False
    37
    38       979       7271.0      7.4     21.5      passwd = encrypt_passwd(passwd)
    39       979        547.0      0.6      1.6      return passwd == db_passwd
This is an example of how to use the memory_profiler in IPython.
In this case, we'll use memory_profiler to understand the memory that is being
allocated when using __dict__ vs __slot__ to store object attributes.
Checking the size of objects that use __dict__ and __slot__ won't make a
difference because what we get is the size of the lists of pointers to the
objects, which is the same size in both cases.
We need to use memory_profiler to understand how much memory the objects consume.
The important metric here is the mebibytes (MiB) which appears in "Increment".
We can see that with __dict__ we get 8.5 MiB and with __slots__ 2.9 MiB;
this is almost 3 times less memory by adding just one line of code.
(optimizing-python) ➜ ipython
Python 3.8.3 (v3.8.3:6f8c8320e9, May 13 2020, 16:29:34)
Type 'copyright', 'credits' or 'license' for more information
IPython 7.15.0 -- An enhanced Interactive Python. Type '?' for help.

In [1]: %run src/slots.py

In [2]: import sys

In [3]: sys.getsizeof(points)
Out[3]: 8697456

In [4]: sys.getsizeof(spoints)
Out[4]: 8697456

In [5]: %load_ext memory_profiler

In [6]: %mprun -f alloc_points alloc_points(n)
Filename: <...>/optimizing-python/src/slots.py

Line #    Mem usage    Increment   Line Contents
================================================
    32    314.4 MiB    314.4 MiB       def alloc_points(n):
    33    508.2 MiB      8.5 MiB           return [Point(i, i) for i in range(n)]


In [7]: %mprun -f alloc_spoints alloc_spoints(n)
Filename: <...>/optimizing-python/src/slots.py

Line #    Mem usage    Increment   Line Contents
================================================
    36    326.7 MiB    326.7 MiB       def alloc_spoints(n):
    37    379.5 MiB      2.9 MiB           return [SPoint(i, i) for i in range(n)]
- Using the command line to view all stats:
(optimizing-python) ➜ python -m cProfile src/prof.py
- Using the command line to output stats to a file:
(optimizing-python) ➜ python -m cProfile --outfile=src/prof.out src/prof.py
- Using the IDE:
Run the profiler on
src/prof.pyas specified in https://www.jetbrains.com/help/pycharm/profiler.html
The src/prof.out file was generated by src.using_cprofile_file.py where we
we run cProfile and use an output file to save all stats.
- Using the command line:
(optimizing-python) ➜ python -m pstats src/prof.out
Welcome to the profile statistics browser.
src/prof.out% stats 3
Thu Jun 11 12:18:52 2020    src/prof.out

         23 function calls in 0.000 seconds

   Random listing order was used
   List reduced from 14 to 3 due to restriction <3>

   ncalls  tottime  percall  cumtime  percall filename:lineno(function)
        1    0.000    0.000    0.000    0.000 {built-in method builtins.exec}
        2    0.000    0.000    0.000    0.000 {built-in method builtins.isinstance}
        1    0.000    0.000    0.000    0.000 <...>/optimizing-python/src/using_cprofile_file.py:7(bench_targeted_login_with_file)


src/prof.out% sort ncalls
src/prof.out% stats 3
Thu Jun 11 12:18:52 2020    src/prof.out

         23 function calls in 0.000 seconds

   Ordered by: call count
   List reduced from 14 to 3 due to restriction <3>

   ncalls  tottime  percall  cumtime  percall filename:lineno(function)
        2    0.000    0.000    0.000    0.000 {built-in method builtins.isinstance}
        2    0.000    0.000    0.000    0.000 <...>/optimizing-python/src/login.py:30(login)
        2    0.000    0.000    0.000    0.000 <...>/optimizing-python/src/login.py:12(user_passwd)


src/prof.out% sort tottime
src/prof.out% stats 3
Thu Jun 11 12:10:40 2020    src/prof.out

         23 function calls in 0.007 seconds

   Ordered by: internal time
   List reduced from 14 to 3 due to restriction <3>

   ncalls  tottime  percall  cumtime  percall filename:lineno(function)
        2    0.007    0.004    0.007    0.004 {method 'execute' of 'sqlite3.Cursor' objects}
        1    0.000    0.000    0.007    0.007 {built-in method builtins.exec}
        2    0.000    0.000    0.007    0.004 <...>/optimizing-python/src/login.py:12(user_passwd)
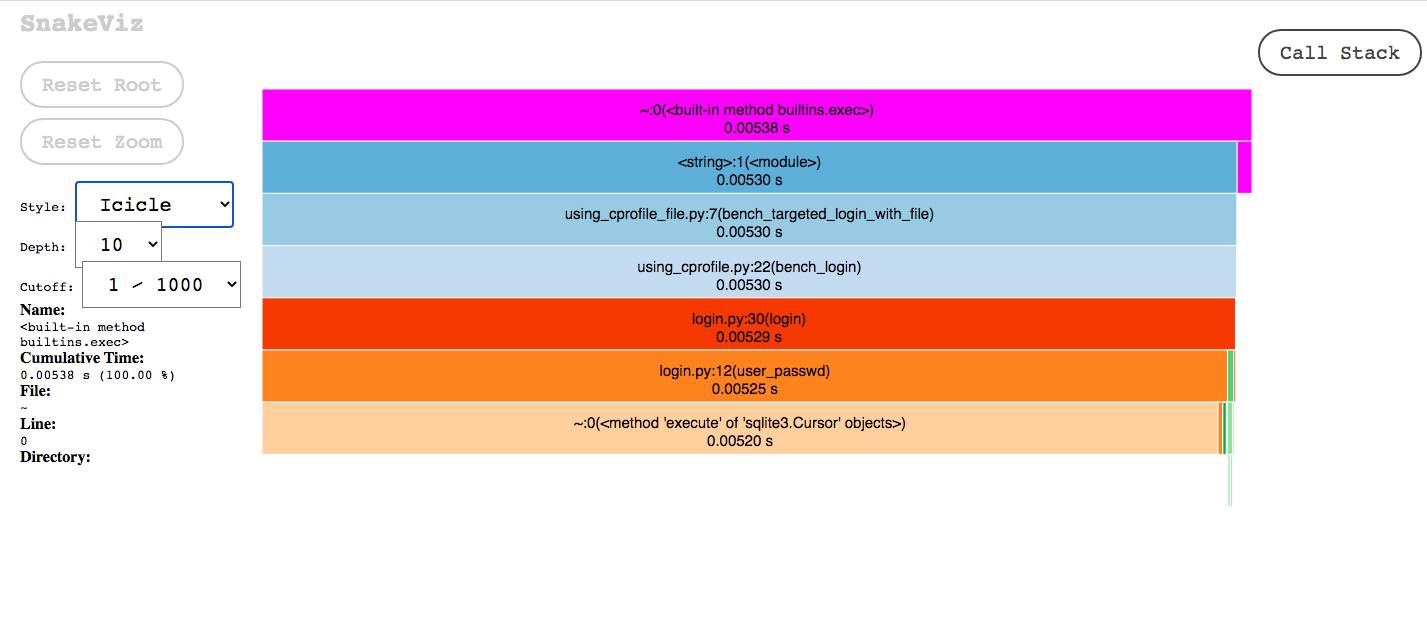
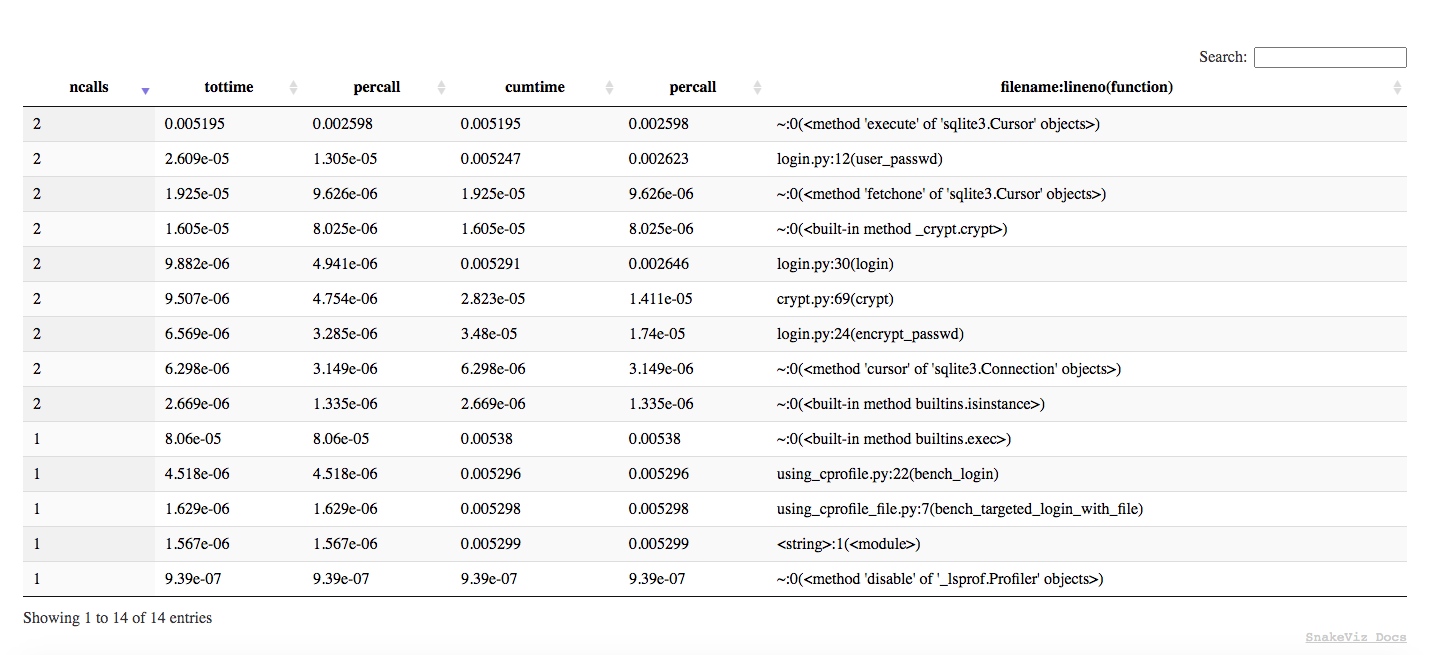
For a much better graphic version of the pstats we can use SnakeViz:
(optimizing-python) ➜ snakeviz src/prof.out
snakeviz web server started on 127.0.0.1:8080; enter Ctrl-C to exit
http://127.0.0.1:8080/snakeviz/<...>optimizing-python%2Fsrc%2Fprof.out
Be aware of the usage of the @profile that will throw error when just running the file.
It should be used just when running kernprof!
This is the command for getting the time profile of a function in a more detailed way:
(optimizing-python) ➜ kernprof -l src/using_line_and_memory_profiler.py
999996
Wrote profile results to using_line_and_memory_profiler.py.lprof
(optimizing-python) ➜ python -m line_profiler using_line_and_memory_profiler.py.lprof
Timer unit: 1e-06 s

Total time: 0.328005 s
File: src/using_line_and_memory_profiler.py
Function: sum_of_diffs at line 4

Line #      Hits         Time  Per Hit   % Time  Line Contents
==============================================================
     4                                           @profile
     5                                           def sum_of_diffs(vals):
     6                                               """Compute sum of diffs"""
     7         1       4270.0   4270.0      1.3      vals2 = vals[1:]
     8
     9         1          3.0      3.0      0.0      total = 0
    10    333333     152049.0      0.5     46.4      for v1, v2 in zip(vals, vals2):
    11    333332     171683.0      0.5     52.3          total += v2 - v1
    12
    13         1          0.0      0.0      0.0      return total
Be aware of the usage of the @profile that will throw error when just running the file.
It should be used just when running memory_profiler!
This is the command for getting the memory profile of a given function:
(optimizing-python) ➜ python -m memory_profiler src/using_line_and_memory_profiler.py
999996
Filename: src/using_memory_profiler.py

Line #    Mem usage    Increment   Line Contents
================================================
     4   50.293 MiB   50.293 MiB   @profile
     5                             def sum_of_diffs(vals):
     6                                 """Compute sum of diffs"""
     7   52.840 MiB    2.547 MiB       vals2 = vals[1:]
     8
     9   52.840 MiB    0.000 MiB       total = 0
    10   52.844 MiB    0.000 MiB       for v1, v2 in zip(vals, vals2):
    11   52.844 MiB    0.004 MiB           total += v2 - v1
    12
    13   52.844 MiB    0.000 MiB       return total
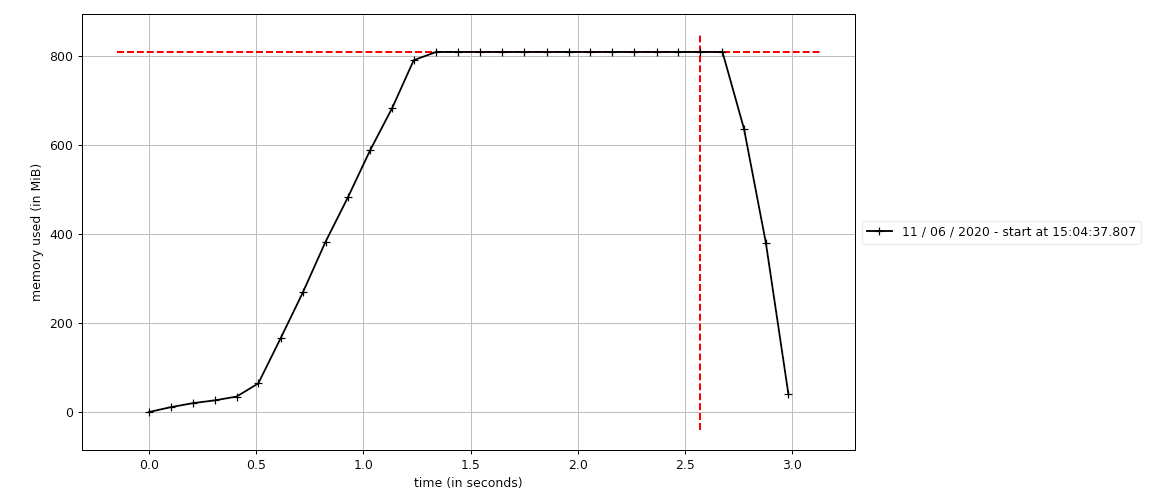
In this example we'll use mprof to generate and see a graph of how our memory
is likely to continue growing for a given function.
We should measure loops over time with mprof and then plot the .dat generated files
to understand potential memory issues.
(optimizing-python) ➜ mprof run src/using_mprof.py
mprof: Sampling memory every 0.1s
running as a Python program...
0
(optimizing-python) ➜ mprof plot mprofile_20200611150437.dat
Using the command on a benchmark test that uses the benchmark fixture.
This test is on test_fib.py. We first run the fib function without cache and then
add the cache decorator to run pytest-benchmark again and see the comparison
of the performance.
(optimizing-python) ➜ pytest --benchmark-autosave
======================================================================================== test session starts ========================================================================================
platform darwin -- Python 3.8.3, pytest-5.4.3, py-1.8.1, pluggy-0.13.1
benchmark: 3.2.3 (defaults: timer=time.perf_counter disable_gc=False min_rounds=5 min_time=0.000005 max_time=1.0 calibration_precision=10 warmup=False warmup_iterations=100000)
rootdir: <...>/optimizing-python
plugins: benchmark-3.2.3
collected 1 item

src/test_fib.py .                                                                                                                                                                             [100%]
Saved benchmark data in: <...>/optimizing-python/.benchmarks/Darwin-CPython-3.8-64bit/0001_aac4f82c7e0fc7bea055e84c1f37861581066d87_20200612_191208_uncommited-changes.json

----------------------------------------------- benchmark: 1 tests -----------------------------------------------
Name (time in ms)          Min       Max      Mean  StdDev    Median     IQR  Outliers     OPS  Rounds  Iterations
------------------------------------------------------------------------------------------------------------------
test_fib              359.9081  382.4121  373.4391  8.3471  375.3431  8.6162       2;0  2.6778       5           1
------------------------------------------------------------------------------------------------------------------

Legend:
  Outliers: 1 Standard Deviation from Mean; 1.5 IQR (InterQuartile Range) from 1st Quartile and 3rd Quartile.
  OPS: Operations Per Second, computed as 1 / Mean
========================================================================================= 1 passed in 5.12s =========================================================================================


(optimizing-python) ➜ pytest --benchmark-autosave --benchmark-compare
Comparing against benchmarks from: Darwin-CPython-3.8-64bit/0001_aac4f82c7e0fc7bea055e84c1f37861581066d87_20200612_191208_uncommited-changes.json
======================================================================================== test session starts ========================================================================================
platform darwin -- Python 3.8.3, pytest-5.4.3, py-1.8.1, pluggy-0.13.1
benchmark: 3.2.3 (defaults: timer=time.perf_counter disable_gc=False min_rounds=5 min_time=0.000005 max_time=1.0 calibration_precision=10 warmup=False warmup_iterations=100000)
rootdir: <...>/optimizing-python
plugins: benchmark-3.2.3
collected 1 item

src/test_fib.py .                                                                                                                                                                             [100%]
Saved benchmark data in: <...>/optimizing-python/.benchmarks/Darwin-CPython-3.8-64bit/0002_aac4f82c7e0fc7bea055e84c1f37861581066d87_20200612_191352_uncommited-changes.json

----------------------------------------------------------------------------------------------------------------- benchmark: 2 tests -----------------------------------------------------------------------------------------------------------------
Name (time in ns)                        Min                         Max                        Mean                    StdDev                      Median                       IQR            Outliers             OPS            Rounds  Iterations
------------------------------------------------------------------------------------------------------------------------------------------------------------------------------------------------------------------------------------------------------
test_fib (NOW)                      207.0000 (1.0)           29,545.0000 (1.0)              259.1928 (1.0)            261.7269 (1.0)              249.0000 (1.0)             50.0000 (1.0)        62;461  3,858,132.3430 (1.0)       28179           1
test_fib (0001_aac4f82)     359,908,106.0000 (>1000.0)  382,412,084.0000 (>1000.0)  373,439,087.2000 (>1000.0)  8,347,108.2545 (>1000.0)  375,343,131.0000 (>1000.0)  8,616,164.2500 (>1000.0)       2;0          2.6778 (0.00)          5           1
------------------------------------------------------------------------------------------------------------------------------------------------------------------------------------------------------------------------------------------------------

Legend:
  Outliers: 1 Standard Deviation from Mean; 1.5 IQR (InterQuartile Range) from 1st Quartile and 3rd Quartile.
  OPS: Operations Per Second, computed as 1 / Mean
========================================================================================= 1 passed in 2.61s =========================================================================================
This project is licensed under the terms of the MIT License. Please see LICENSE for details.


