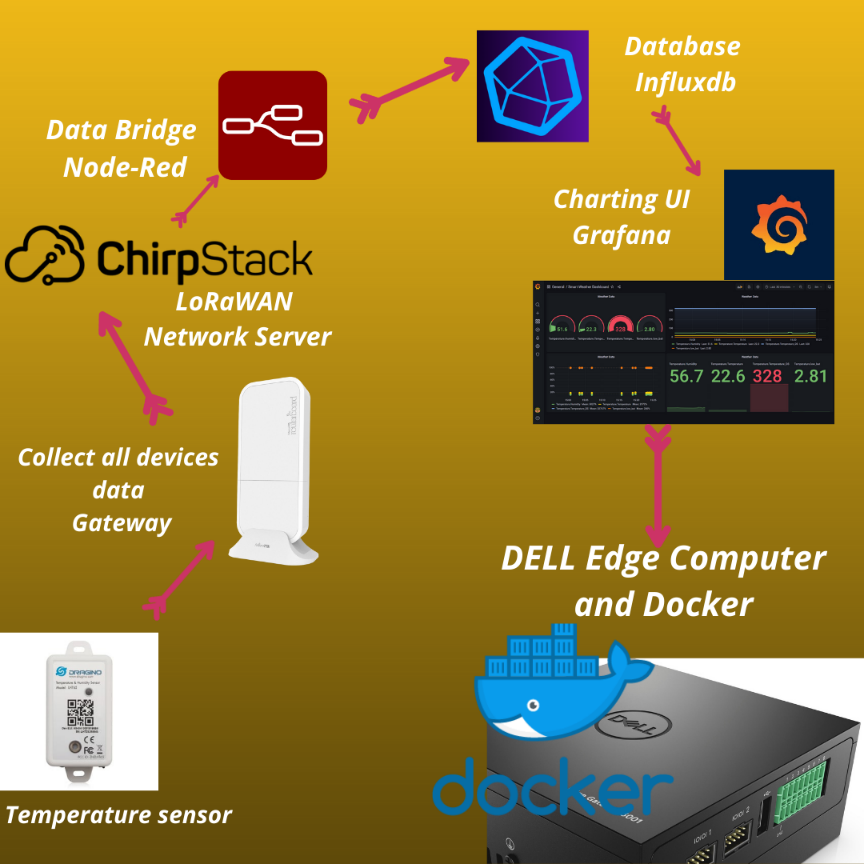
Hi all, there is a very quick guide how to configure a system monitoring for one or more servers using a modern stack of technologies, like Node-Red, Grafana, Docker with Influxdb.
Linux OS-ubuntu20.04 Docker InfluxDB (Time series database) Grafana (Data visualization platform) Node-Red (A flow-based programming tool)
ChirpStack (Open-source LoRaWAN Network Server)
Dell Edge Computer Dragino Temperature and Humidity sensors Mikrotik Gateway
-
Installing InfluxDB, Grafana, Node-RED & ChirpStack as Docker containers
-
Creating a database in InfluxDB
-
Connecting a data source to Grafana
-
Using a gateway to forward sensors data to NS ChirpStack
-
Using Node-RED to collect NS data and the publishing of measurements to InfluxDB
-
Create a simple web dashboard in Grafana
-
By default, it was installed Ubuntu 18.04 LTS. Then I update the latest version ubuntu 20.04.3 LTS.
-
sequence from 18.04 to 20.04
  $ sudo apt update
  $ sudo apt upgrade
  $ sudo apt dist-upgrade
  $ sudo apt autoremove
  $ sudo do-release-upgrade -d -f DistUpgradeViewGtk3
- After that I got some error. For this reason, when I try to install or update, it showed below error.
Ubuntu – dpkg: error processing archive /var/cache/apt/archives/cuda-cublas-9-1_9.1.85.3-1_amd64.deb (–unpack)
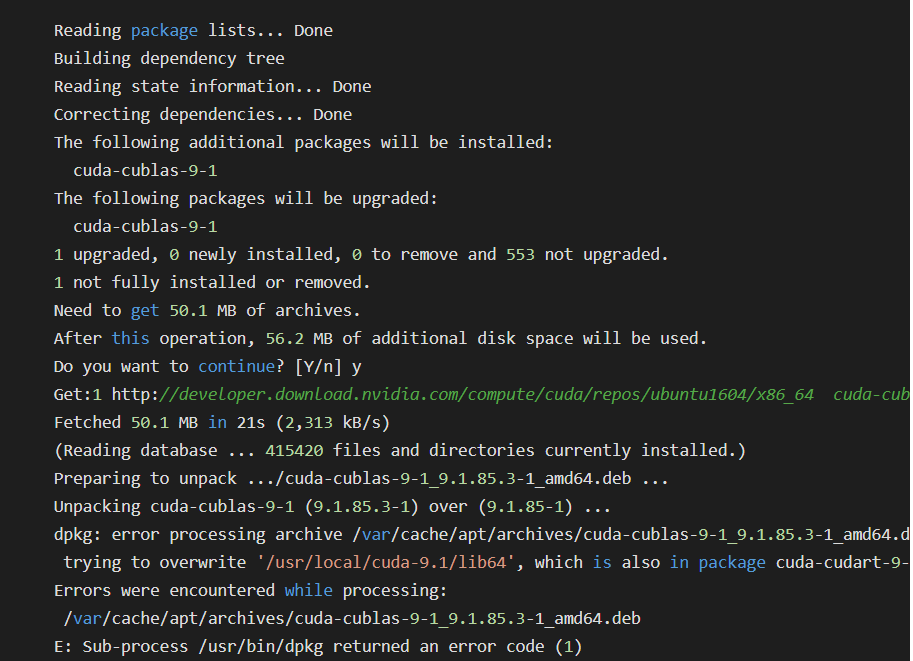
The "trying to overwrite" error implies that i have conflicting packages in my system. I try overwriting the package (can be a bit risky).
$sudo dpkg -i --force-overwrite /var/cache/apt/archives/cuda-cublas-9-1_9.1.85.3-1_amd64.deb
If that doesn't fix it, you can remove the package and re-install it.
$sudo dpkg -P cuda-cublas
- At first, we should install docker engine on ubuntu 20.04 LTS. Let’s do it by this command.
  $ sudo apt install docker.io
  $ docker –version
  $ sudo systemctl enable –now docker
  $ sudo systemctl status docker
- It will show,

- For final check we can run,
  $ sudo docker run hello world
  $ sudo docker ls -a
- Manage docker as a non-root user,
  $ sudo groupadd docker
  $ sudo usermod -aG docker $USER (User mean your system username)
  $ newgrp docker
-
Verify that you can run docker commands without sudo.
-
Finally, install docker composer when we will run docker.yml file. That time we should use docker composer.
$ sudo curl -L "https://github.com/docker/compose/releases/download/1.29.2/docker-compose-$(uname -s)-$(uname -m)" -o /usr/local/bin/docker-compose -
Apply executable permission to the binary:
  $ sudo chmod +x /usr/local/bin/docker-compose
  $ docker-compose --version
- Now we will install Influxdb and Grafana both with docker-compose.yml.
- At first, we need to create folder for our project, for example /opt/monitoring,
$ mkdir /opt/monitoring && cd /opt/monitoring

$ vi docker-compose.yml
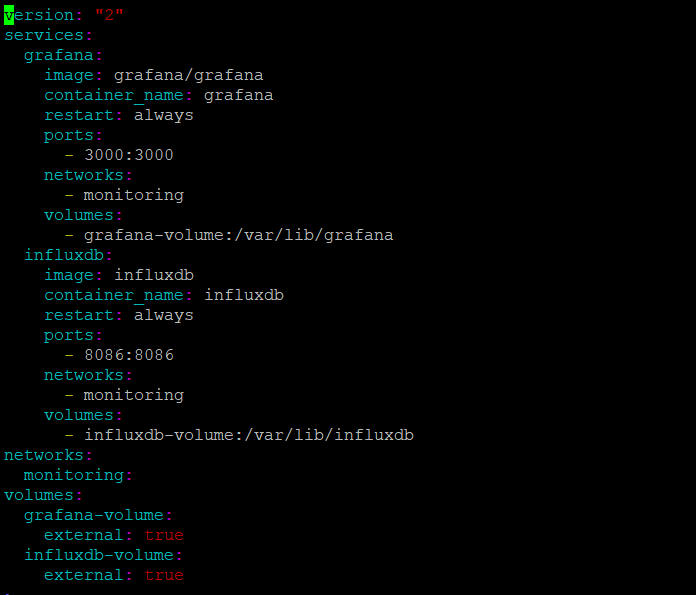
- Now we need to create this docker network and volumes:
  $ docker network create monitoring
  $ docker volume create grafana-volume
  $ docker volume create influxdb-volume

- As we can see the network and volumes was created OK, now we need to prepare the Influxdb parameters, for this we’ll run the container with some environment variables for creating database and users:
	$ docker run --rm \
	  -e INFLUXDB_DB=TESTDB -e INFLUXDB_ADMIN_ENABLED=true \
	  -e INFLUXDB_ADMIN_USER=admin \
	  -e INFLUXDB_ADMIN_PASSWORD=admin \
	  -e INFLUXDB_USER=TESTDB -e INFLUXDB_USER_PASSWORD=admin \
	  -v influxdb-volume:/var/lib/influxdb \
	  influxdb /init-influxdb.sh
Finally, all preparations are done, and we ready to start our new monitoring system, will do it by using docker-compose, go to the /opt/monitoring and run:
$ docker-compose up -d
- OK, all containers are created and started, so our monitoring system ready to serve incoming requests. We expose few ports, as you can see in docker-compose file, the 8086 HTTP API port for Influxdb data and port 3000 for Grafana web UI. And we almost done with our new monitoring system, it’s really quick and easy using Docker. To fully complete we only need to configure Grafana a bit, create a dashboard and new data source for Influxdb. For this will go to our server1 public_ip:3000 (192.168.0.1:3000 in our example) in browser, and login to the Grafana web UI for very first time using:
	login: admin
	password:admin
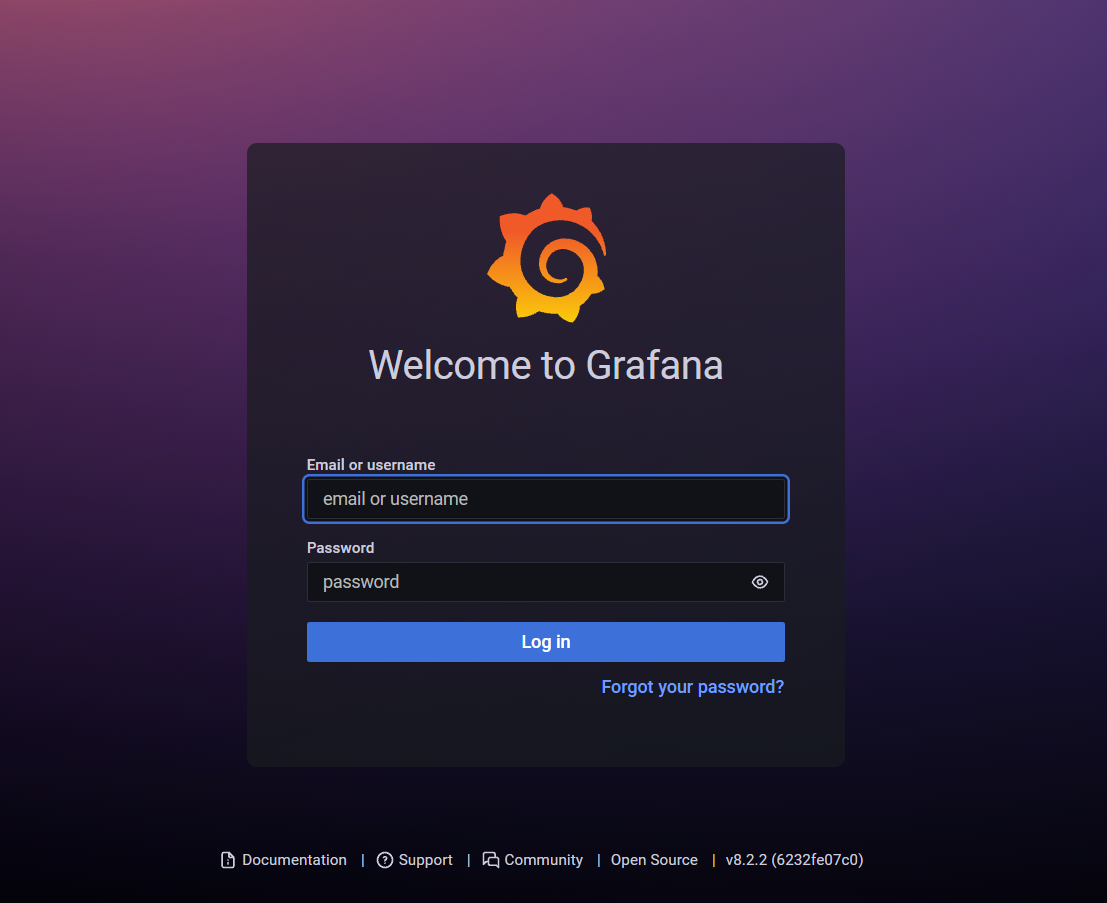
- Then Grafana will ask you to change password, and after that you’ll get inside:
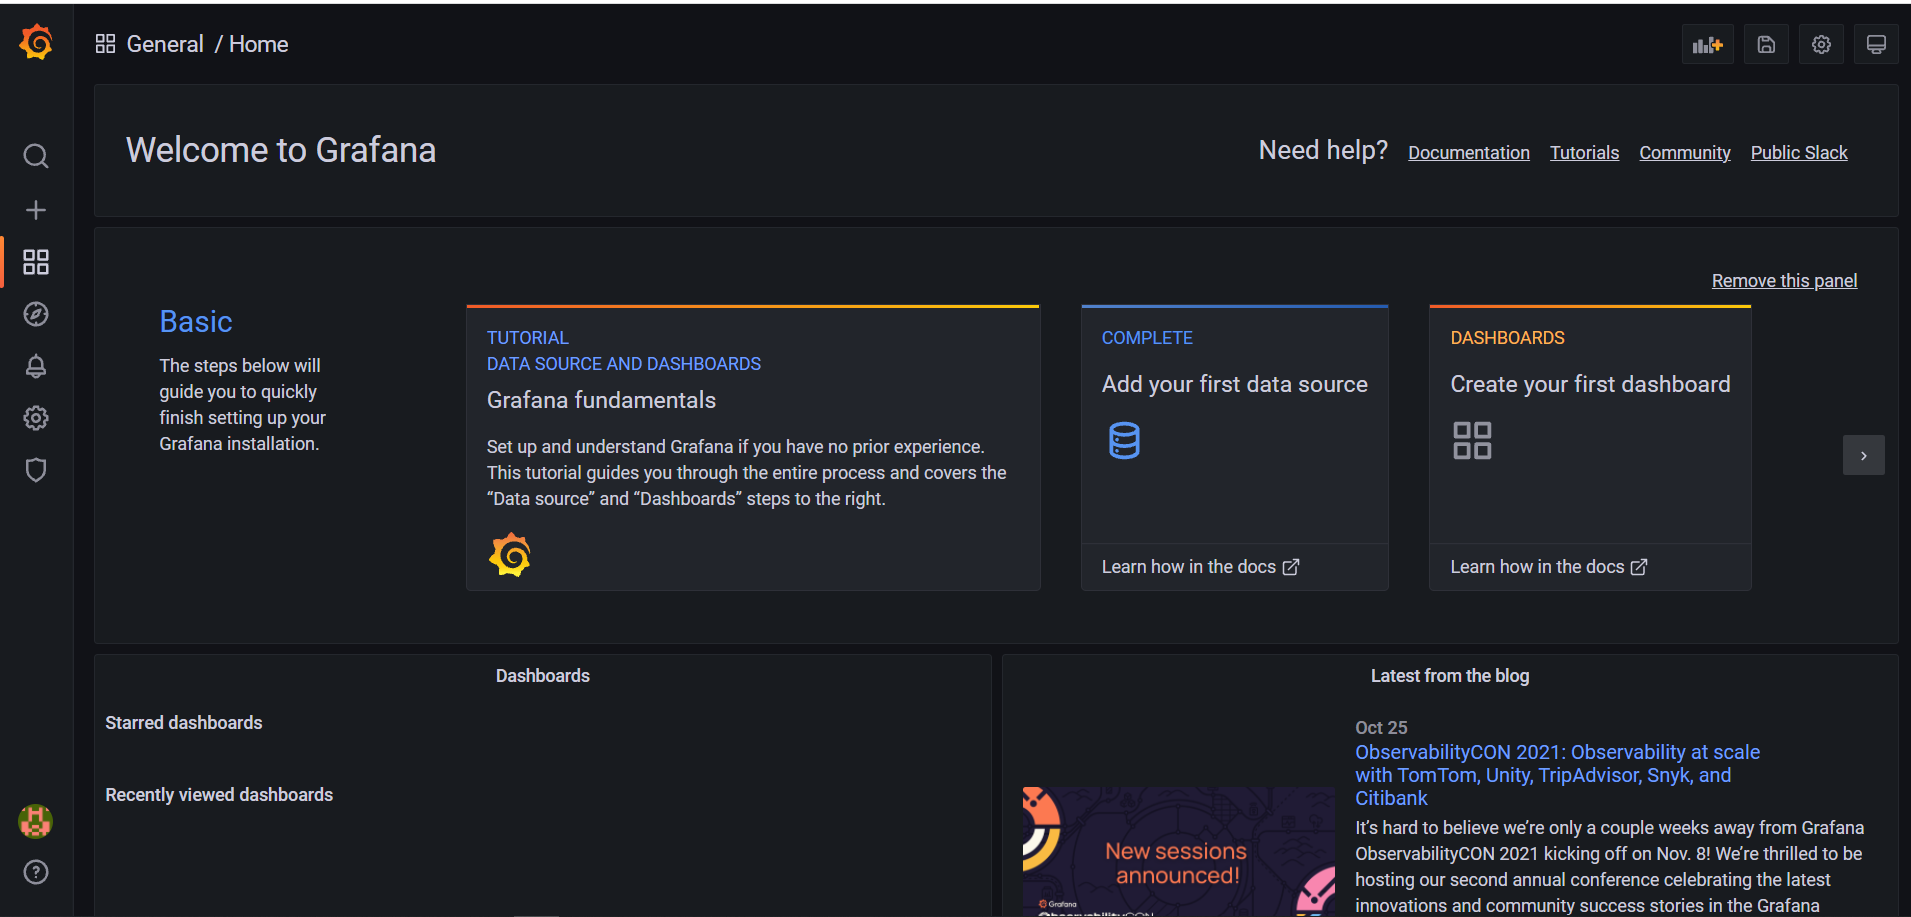
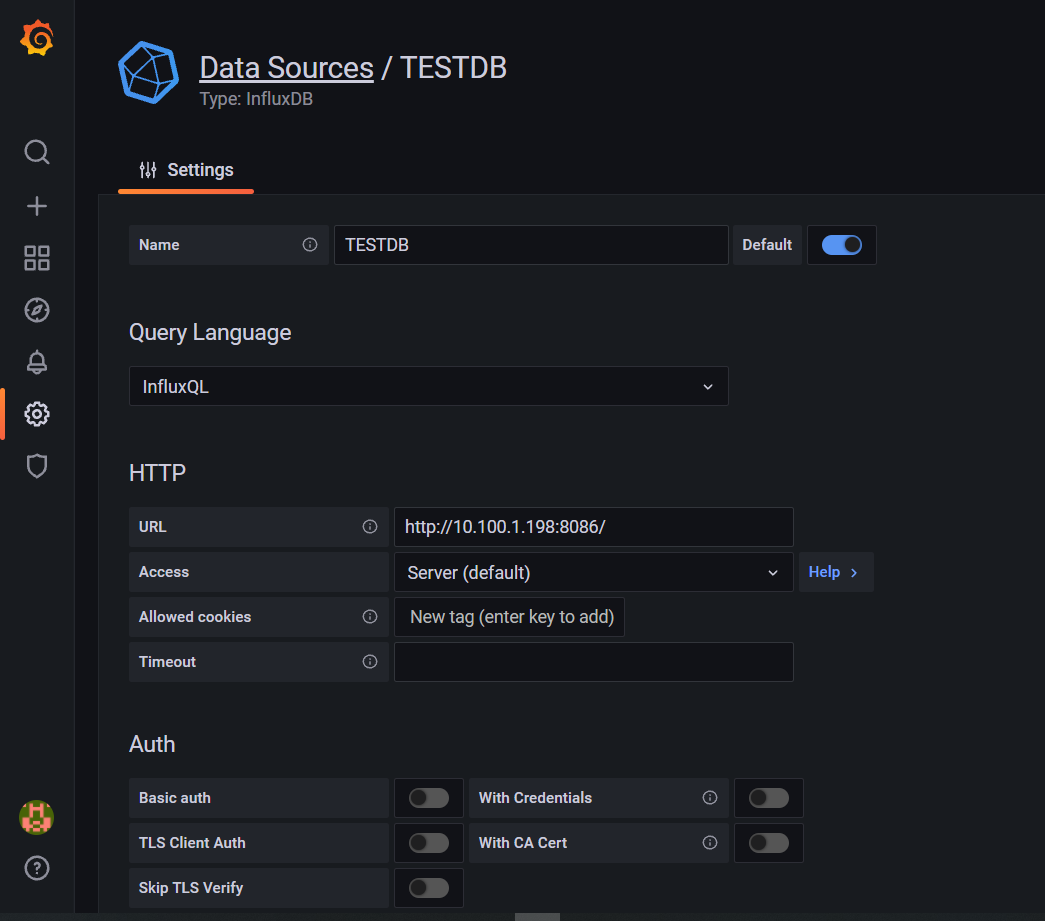
- There we need to select Type = TESTDB, give the Name for this data source, then put the URL using our influxdb container name as address. As I say previously Docker give to us an easy service discovery so. OK, we also need to insert the Database name and user/password for our database, these parameters were created by previously running the Influxdb container. Click on Save & Test to see that your data source is OK:

- Great we just added our influxdb as data source for Grafana, for the time economy we’ll take a prepared dashboard that contains most popular parameters, go to the grafana.com and select one you like. For example, this:
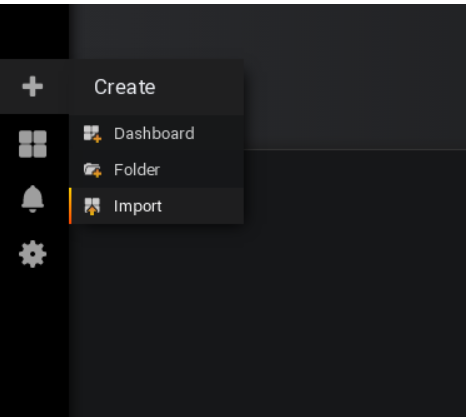
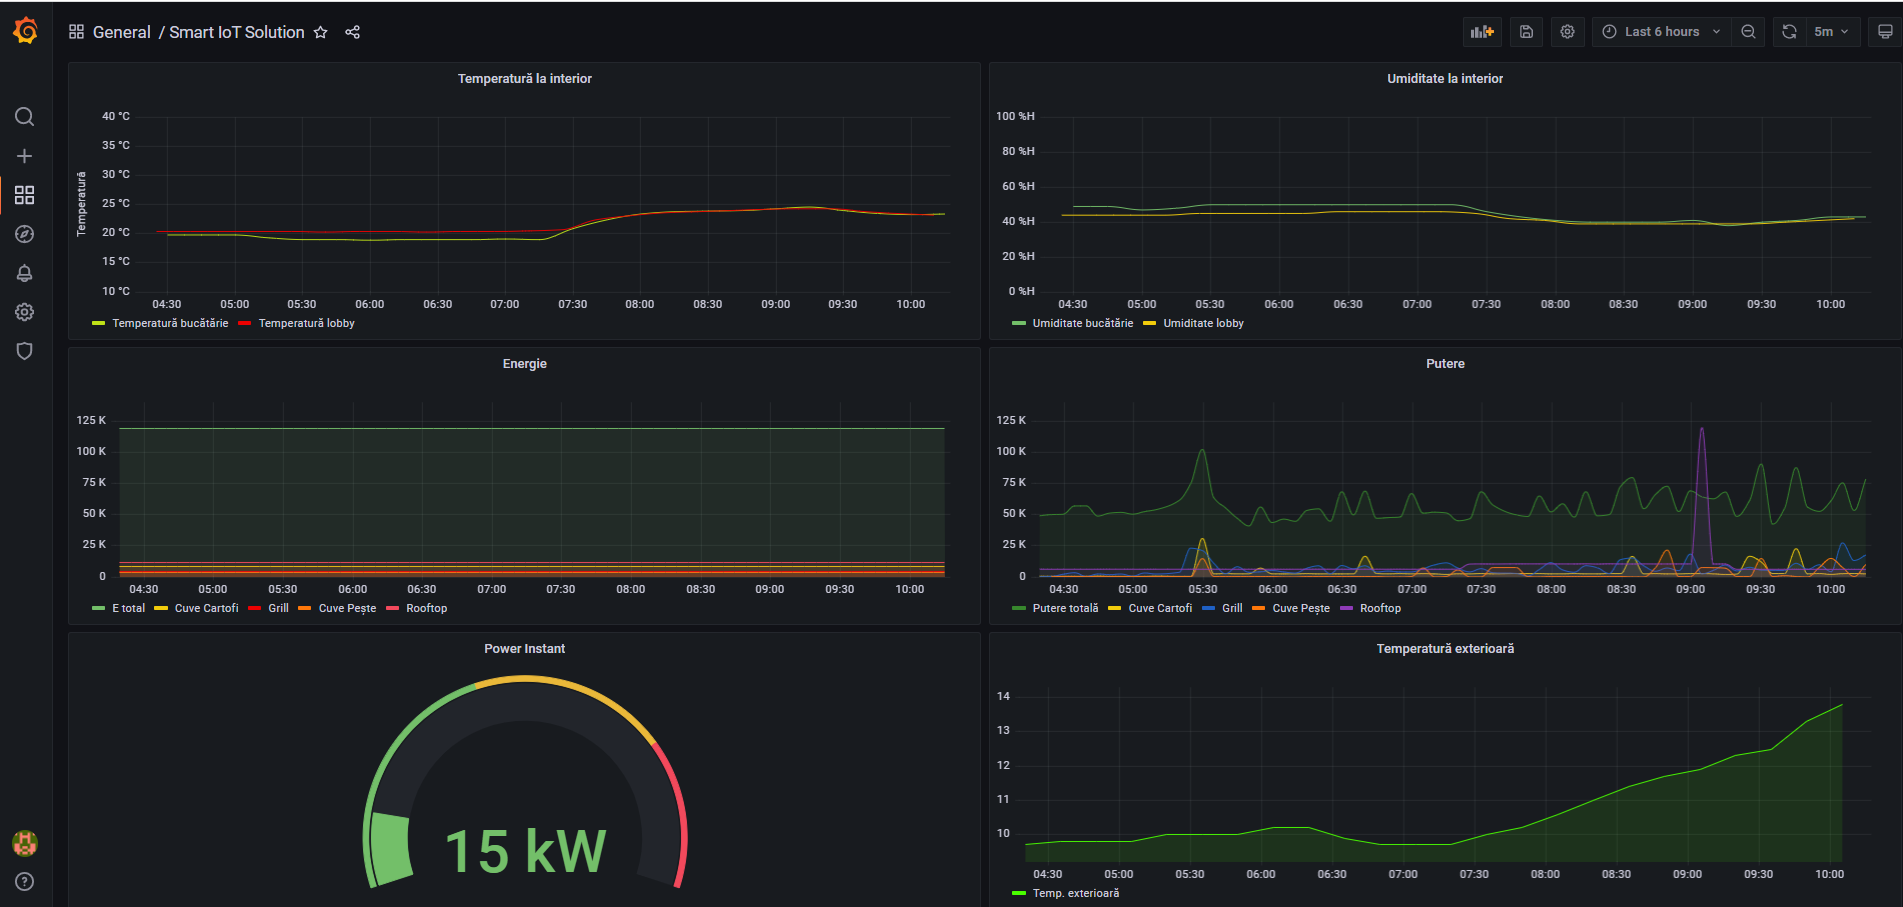
- Well done now we have a nice 😊 dashboard for minimum of time:
YouTube TowardsdataScience.com
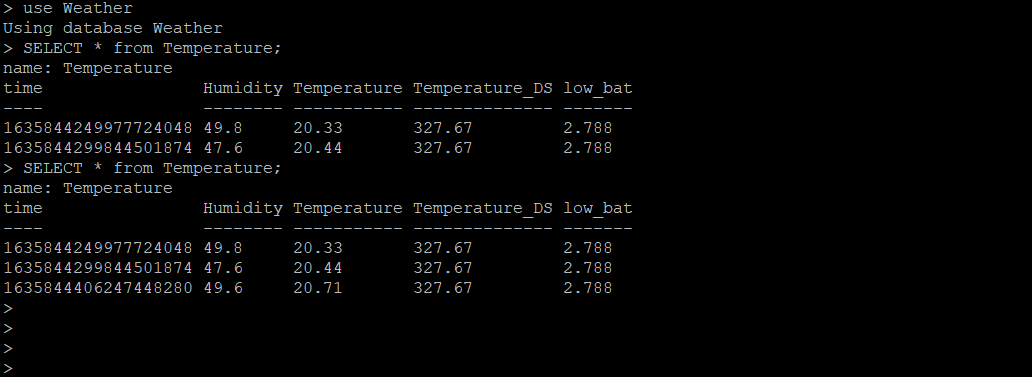
-
Problem solutions
-
If we fail to login influxdb server by influx command, what will we do?
$sudo apt update
$sudo systemctl enable influxdb
$sudo systemctl unmask influxdb
$sudo systemctl start influxdb
$ influx
$ CREATE USER admin WITH PASSWORD 'admin' WITH ALL PRIVILEGES
exit
$ sudo nano /etc/influxdb/influxdb.conf
HTTP
enable = true
bind-address: 8086
For more information, InfluxDB & Grafana
- We can use docker for installing ChirpStack. Install the ChrpStack on ubuntu using docker
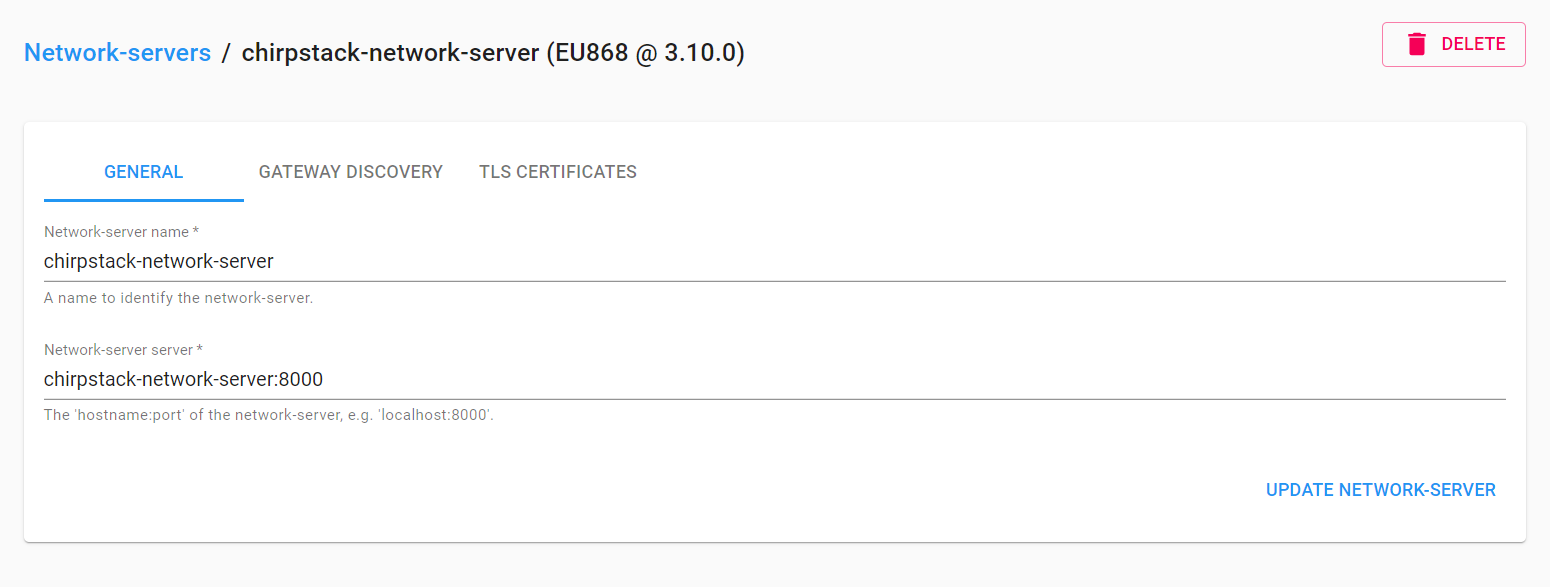
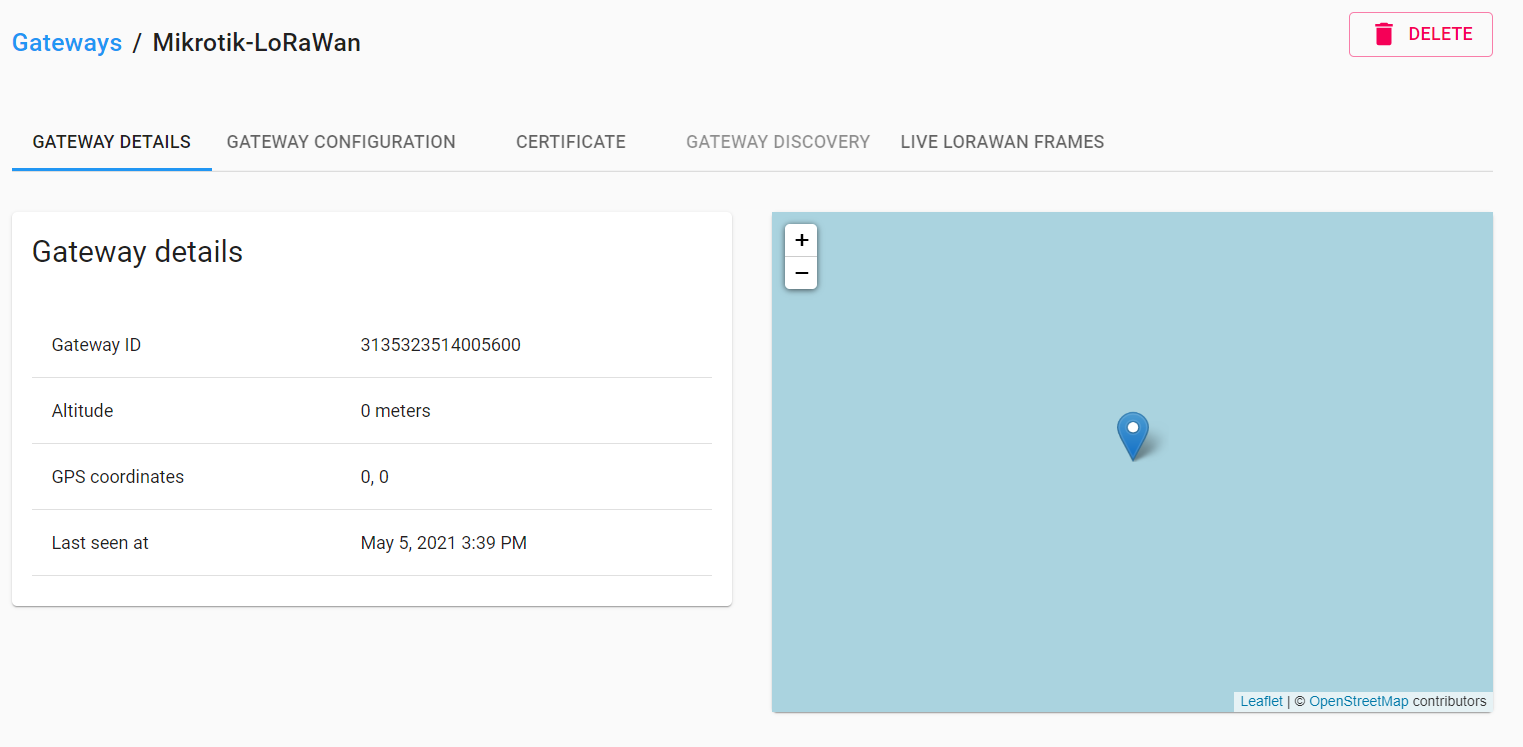
Now we will set up our Network server with the gateway. For testing purposes, I use the Mikrotik gateway.
- Add network server,

- Check Gateway connection,

- Application is for one site or one project. We can add a lot of devices to one application. If we create three projects like MacDonald, KFC, Ford. Each one is one application. We can add many devices to one application. So, one application is enough for many devices.

- After creating the application, we should create a devices profile because we must add devices under the application project.


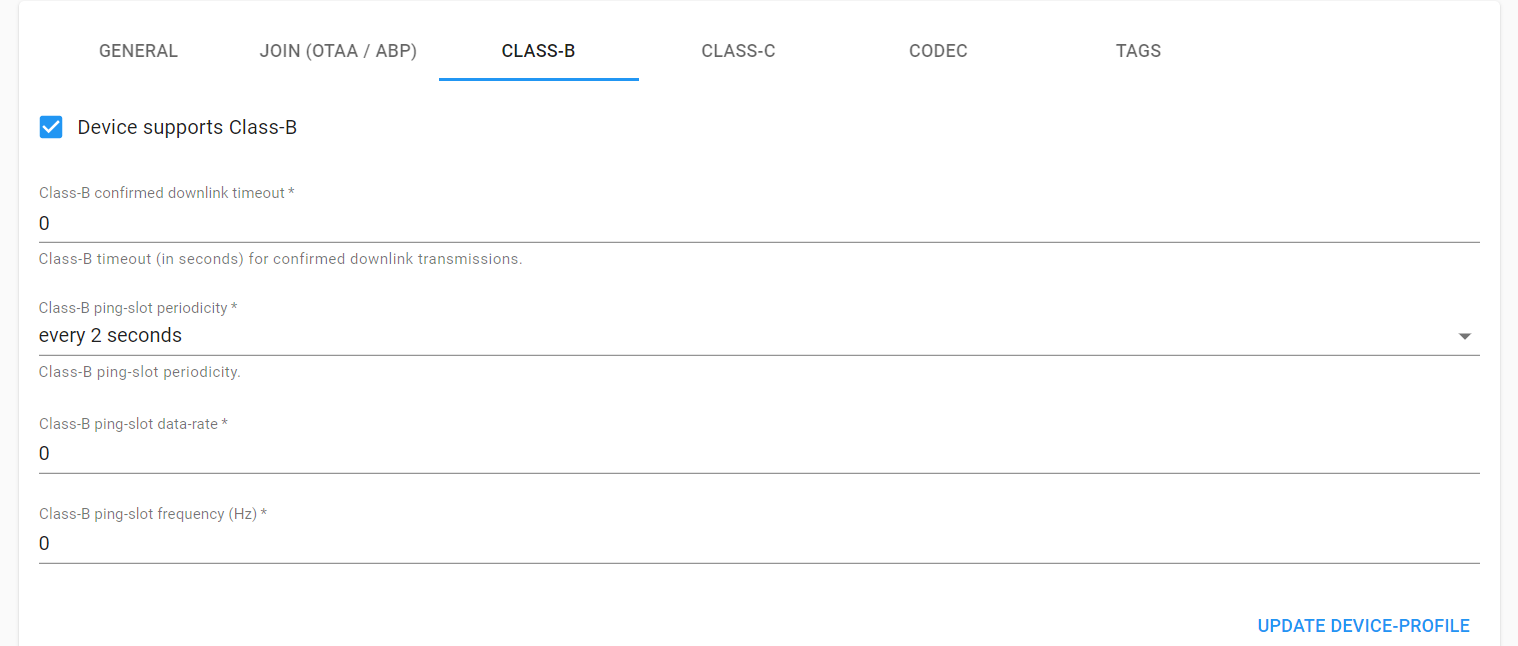

- After that we must go back to the application profile then add devices under the application.
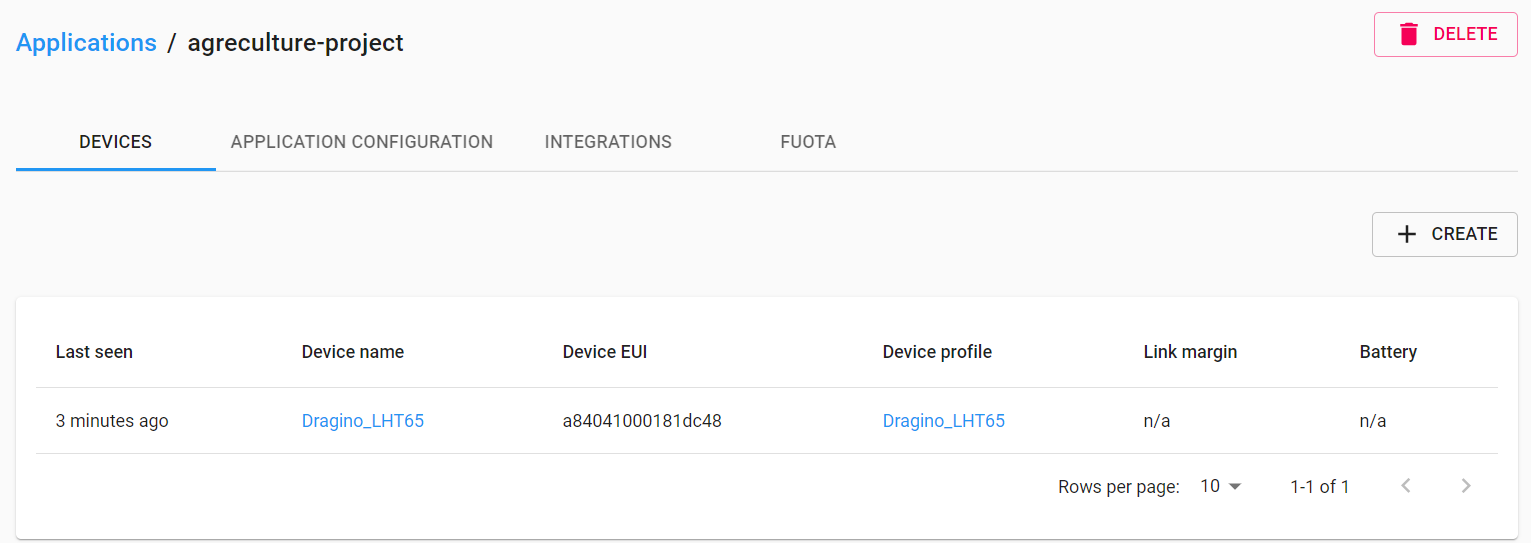
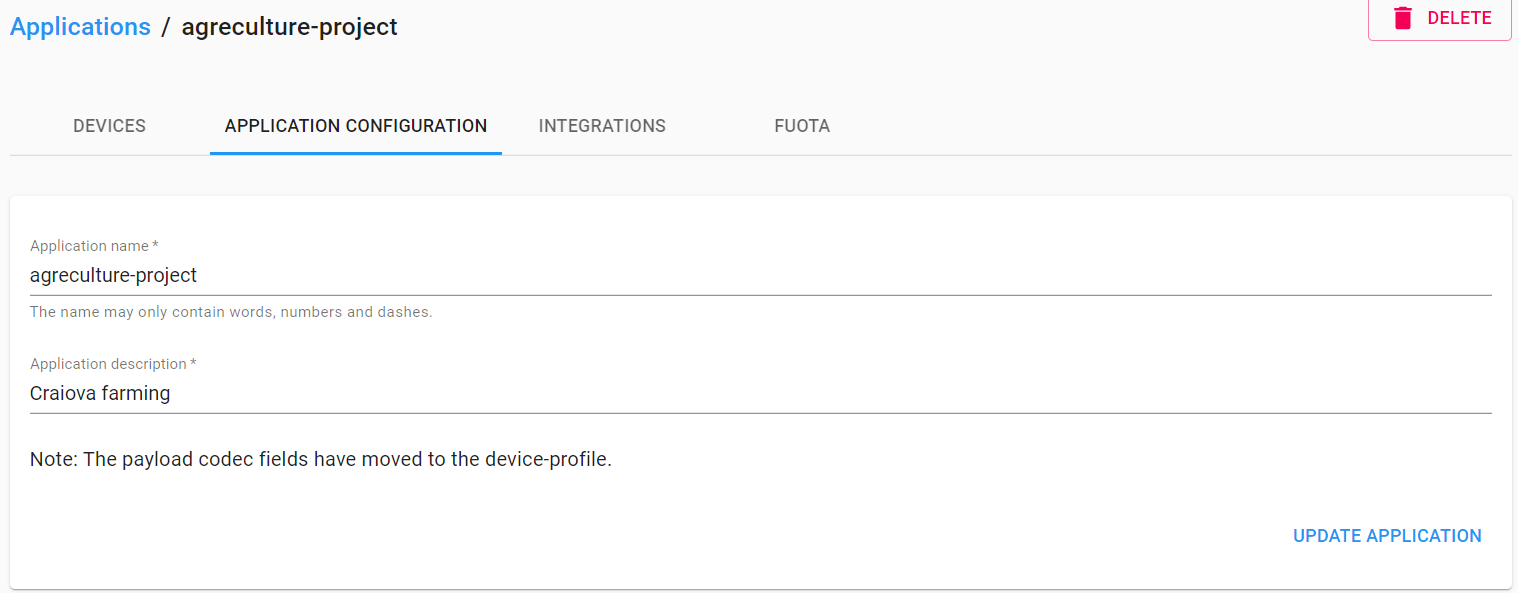
Integration means we must choose which application server we'll send our data to. Like thingsboard or othees?
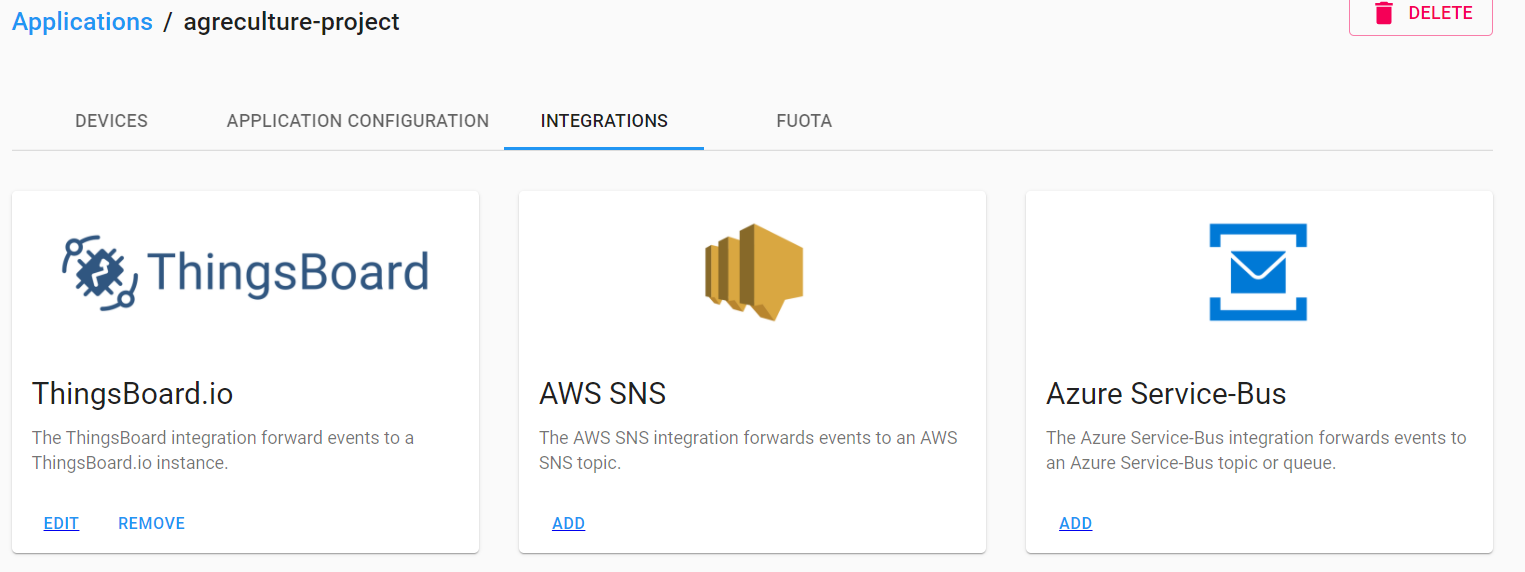
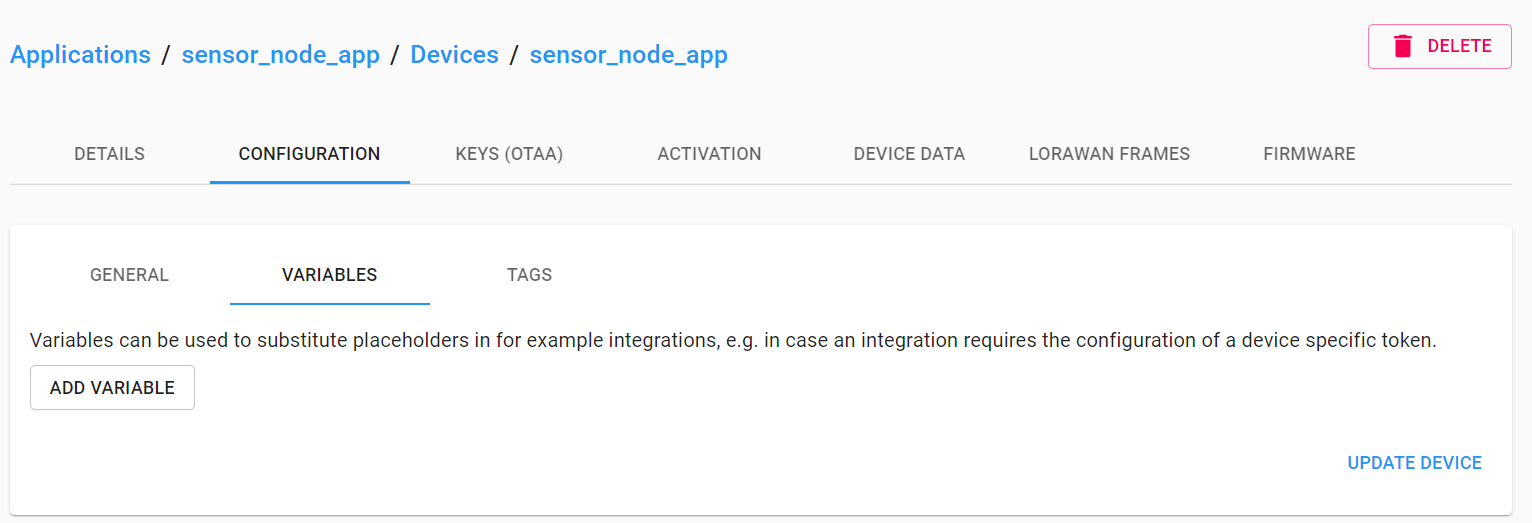
- We have to put dashboard devices credential in a variable. When we open a device on the dashboard. We’ll find a name and value
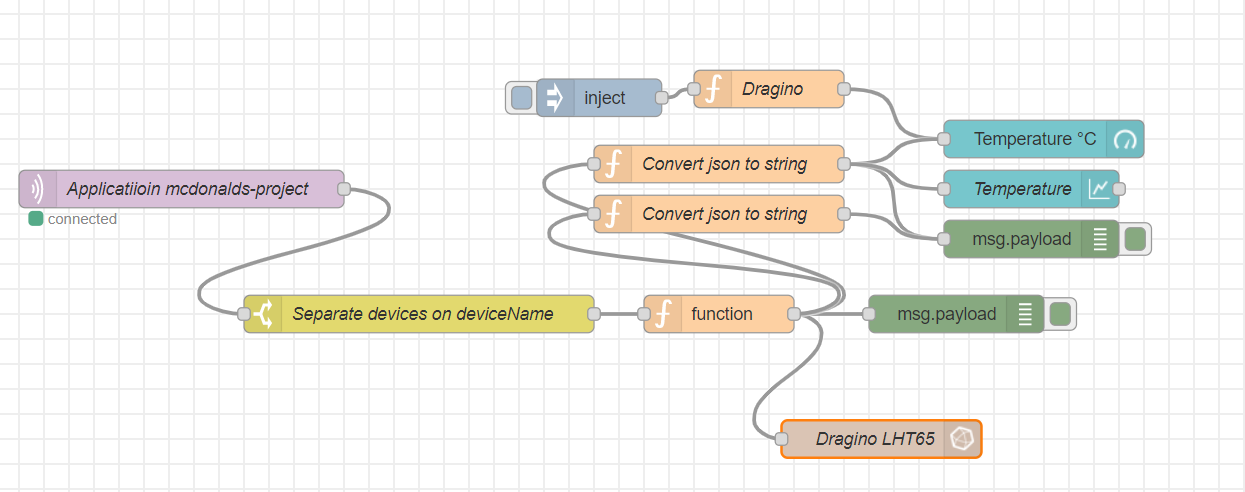
- Node-Red flow to collect data from ChirpStack and Send those data to Influxdb.
Visit our official website: Polisea S.A
🚩 Connect with me on social
🔔 Subscribe to my YouTube channel: YouTube
