Kmer histogram data for the development of depth coverage function in PreseqR
Purpose
Kmer histogram data was generated in order to extend the the Rational Function Approximation (RFA) approach to used by Preseq (Daley and Smith, 2013) and PreseqR (Deng et al., 2015) to estimate sequence coverage as a function of total sequencing. The software packages Nonpareil (Rodriguez-R and Konstantinidis, 2014) and KmerSpectrumAnalyzer (Williams et al., 2013) perform related estimates, but RFA may make the approach more accurate and scalable.
Data
I calculated Kmer histograms for 12 of the 14 datasets in the Nonpareil paper (Rodriguez-R and Konstantinidis, 2014) and three well-characterized metagenome datasets from the Joint Genome Institute (JGI).
| Data | Description |
|---|---|
| SRR061157.fastq.gz | Biosample SRS016335 Human stool |
| SRR061189.fastq.gz | Biosample SRS063417 Posterior fornix |
| SRR062429.fastq.gz | Biosample SRS019087 Human buccal mucosa |
| SRR062436.fastq.gz | Biosample SRS019087 Human anterior nares |
| SRR062519.fastq.gz | Biosample SRS015574 supragingival |
| SRR346700.fastq.gz | Biosample SRS062540 Tounge Dorsum |
| SRR948155.fastq.gz | Biosample SRP028408 Lake Lanier LL_1007B |
| mgm4477807.fastq.gz | Biosample PE6 Manu Park (Peru) Tropical Forest |
| SRR512581.fastq.gz | Biosample SRS345554 Active layer day 2 |
| SRR512766.fastq.gz | Biosample SRS345600 Permafrost layer day 2 |
| SRR096387.fastq.gz | Biosample SRA029314.1 Lake Lanier LL_S2 |
| SRR096386.fastq.gz | Biosample SRA029309.1 Lake Lanier LL_S1 |
| 6558.7.47340.GTGAAA.fastq.gz | Wetland Surface Sediment Aug2011 Site B2 Bulk Metagenome (high complexity) |
| 8852.1.113741.GTAGAG.fastq.gz | Crystal Bog metaG CBE16Jul07 (medium complexity) |
| 6735.7.52359.AGTTCC.fastq.gz | Biofuel Metagenome 4 (low complexity) |
| MC04.fastq.gz | Mock metagenome 04 ( a mix of ~800 isolate genome fastq reads) |
| MC06.fastq.gz | Mock metagenome 06 ( a mix of ~800 isolate genome fastq reads) |
| MC13.fastq.gz | Mock metagenome 13 ( a mix of ~800 isolate genome fastq reads) |
| MC39.fastq.gz | Mock metagenome 39 ( a mix of ~800 isolate genome fastq reads) |
Methods
Generating kmer histogram data
For each dataset, I have placed 31-mer count histograms are in the directory k31counts. These data were generated using the Bbtools package program kmercountexact.sh. A kmer histogram could not be calulated exactly for the high complexity sample 6558.7.47340.GTGAAA.fastq.gz on a 248GB memory node and had to be estimated using Bbtools package program khist.sh, which uses a Bloom filter for approximate kmer counting. The three JGI samples are 2x150 base pair illumina libraries with a 270 base pair tareget insert size.
Validation with mock metaenome
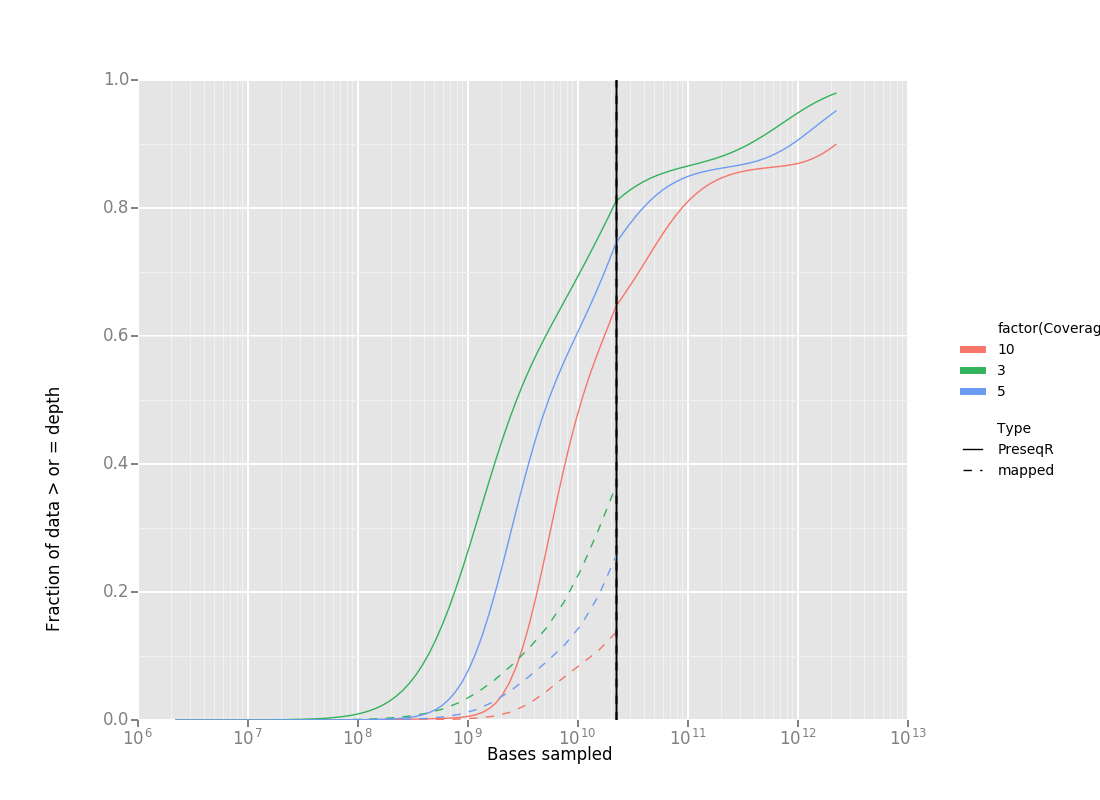
The 31mer histograms were calulated for the four mock communities as described above. MC04 was selected for further testing. The file was subsampled at 20 logrithmically distributed depths 100% -0.1% with bbmap. An Rscript was written to call PreseqR and generate a JSON of the extimated coverage depth from the 31mer histogram (coverage_est.R). That R script is called by the python script "coverageparser.py", which loads the mapping data, runs coverage_est.R and combines the data into one graph.
Dependencies
coverage_est.R
- PreseqR prerelease from their github repo (you may need the R devtools package to do this.
- R package reshape2
- R package argparser coverageparser.py
- ggplot python package
Comparison to mapping
The preseqR estimates of coverage based on 31-mers differ from mapping to known genomes in the case of the mock community. After discussions with several poepel I think this is okay becasue they are measuring different things. The Kmer-based estimate is independent of the number of unique genomes in the metagenome and their abundances. This is desirable becasue small changes in the long tail of low abundace genomes can vastly change the proportion mapped. Those genomes would however never be assembled either. For estimating assembly completeness the kmer-based method is likely better.
Next steps
The The kmer based coverage metrics at different depths should be calulated for a selection of varied metagenomes and compared to assembly metrics to explore corrlelations.
I have talked to Alex and Bryce about adding the metric to RQC and retroactivly calulating it for all JGI metagenomes. It would be nice to use it as a tool for allocating sequencing lanes based on sample attributes.
References
Daley, T., and Smith, A. D. (2013). Predicting the molecular complexity of sequencing libraries. Nat. Methods 10, 325–327. doi:10.1038/nmeth.2375.
Deng, C., Daley, T., and Smith, A. (2015). Applications of species accumulation curves in large-scale biological data analysis. Quant. Biol. 3, 135–144. doi:10.1007/s40484-015-0049-7.
Rodriguez-R, L. M., and Konstantinidis, K. T. (2014). Nonpareil: a redundancy-based approach to assess the level of coverage in metagenomic datasets. Bioinformatics 30, 629–35. doi:10.1093/bioinformatics/btt584.
Williams, D., Trimble, W. L., Shilts, M., Meyer, F., and Ochman, H. (2013). Rapid quantification of sequence repeats to resolve the size, structure and contents of bacterial genomes. BMC Genomics 14, 537. doi:10.1186/1471-2164-14-537.
