A power Bi project about a marketing & sales synthetic dataset
The dataset used is a simulated dataset provided by Foresight Bi.
This mock-dataset, simulated but realistic, presents pharmaceutical sales in two European markets: Germany and Poland. The company does not sell directly to customers but works through a network of distributors in each region.
The dashboard allow a deep dive into data analysis through several pages:
- The Executive summary page provides an overview of sales dynamics.
- The Distributor Analysis page shows the performance of the distribution network.
- The Sales Team Performance page displays the performance of each sales team.
- The Team Monitoring YTD page focuses on an individual collaborator's sales and their personal targets.
- Finally, the Sales Forecast Analysis page offers a simple visual tool for simulating sales forecasts based on simple moving averages.
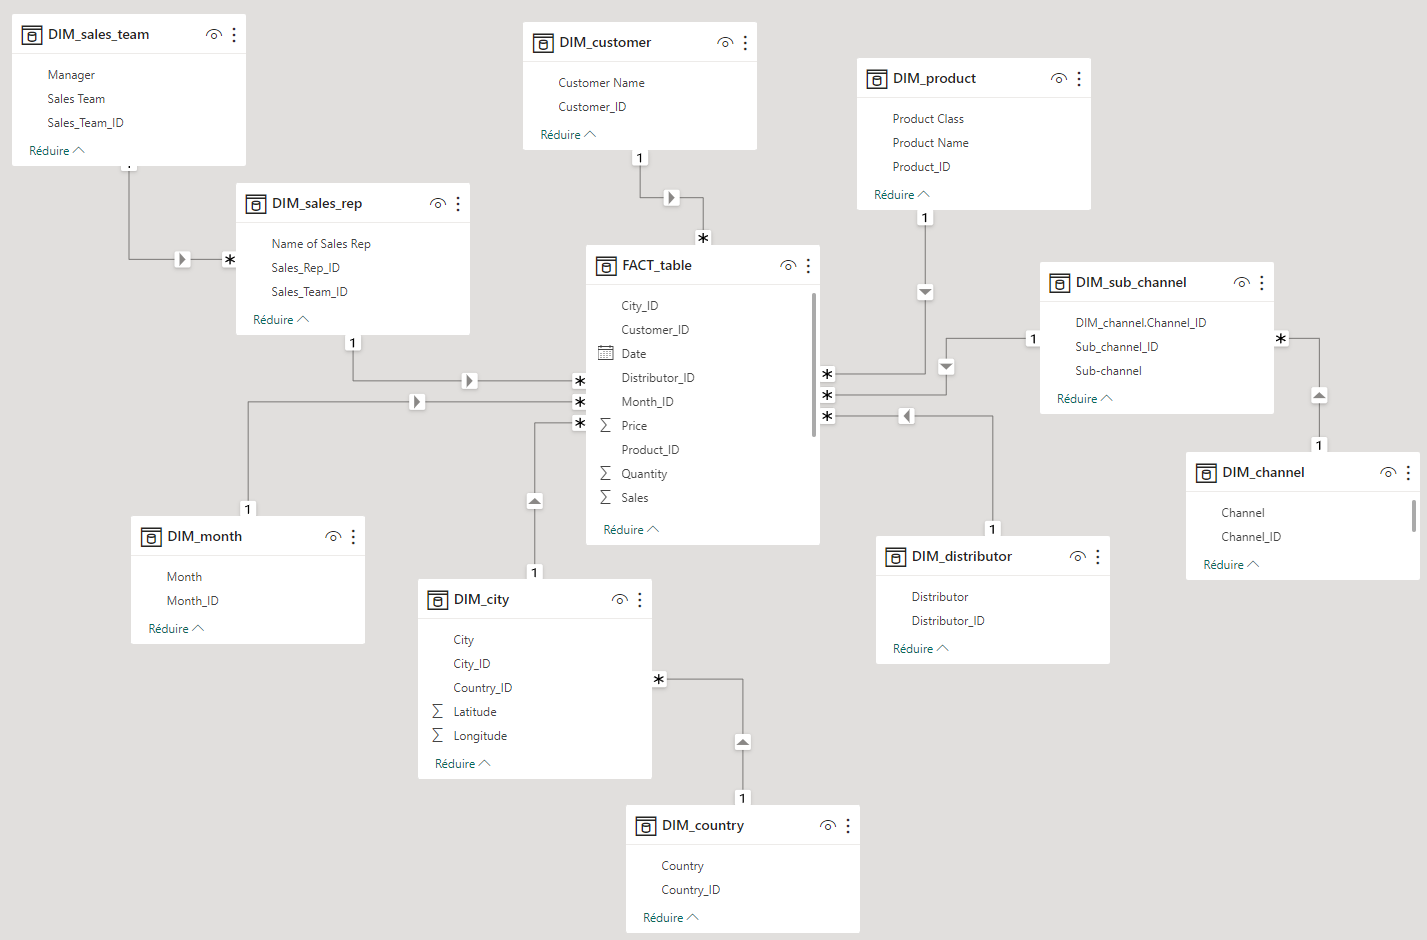
- The source file is a flat .csv file. However, to optimize the operation of the table, the initial table was converted into several logically linked tables structured to respect the star schema.
- The tables with the "DIM" prefixes are the dimension tables. The table with the "FACT" prefix is the fact table (1 fact = 1 sale).
- This dashboard offers a good overview of what Power Bi is capable of in terms of graphics and dynamic display. The "team Monitoring YTD" page has been designed to be completely dynamic.

In case of any questions about this dashboard, or for any suggestions for improvement, please contact arnaud.duigou@data-boost.fr.