https://arnoldlindlau.shinyapps.io/barglary
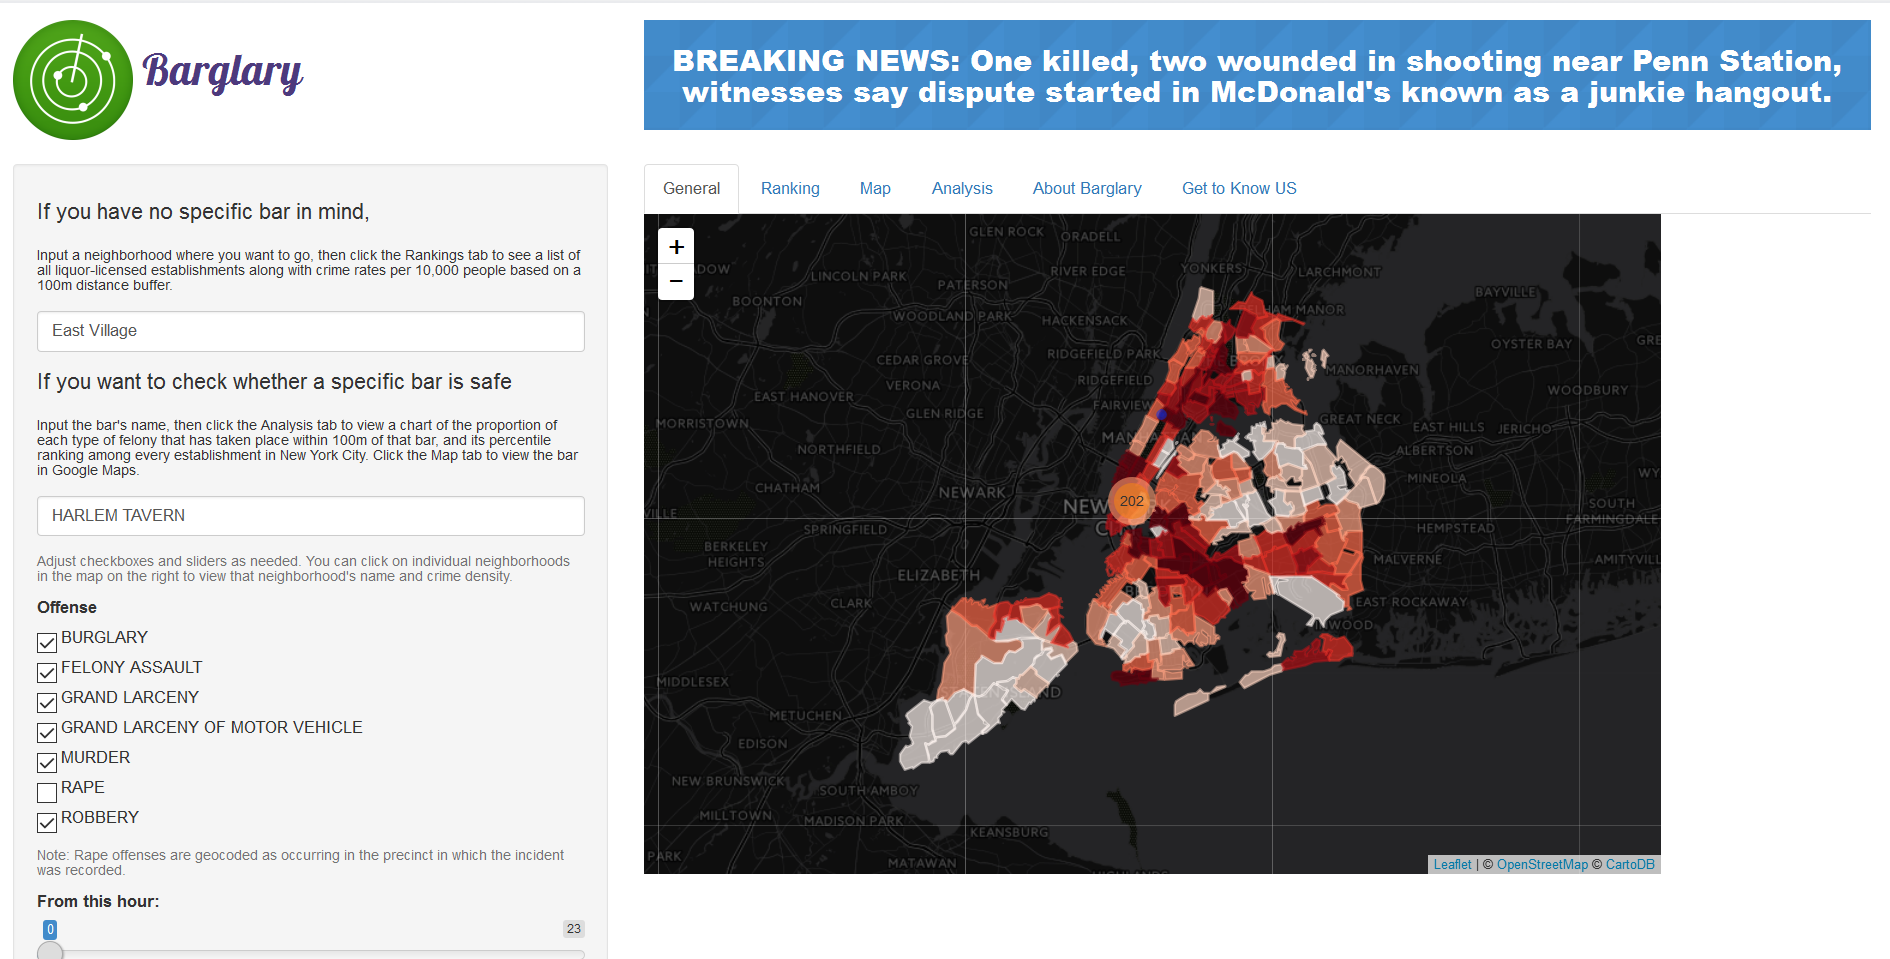
This is a data visualization app produced with RStudio's Shiny and with Leaflet. It has the following features:
- Interactive map of crime rates across each of NYC's neighborhoods, adjustable by type of crime, date and time of occurrence.
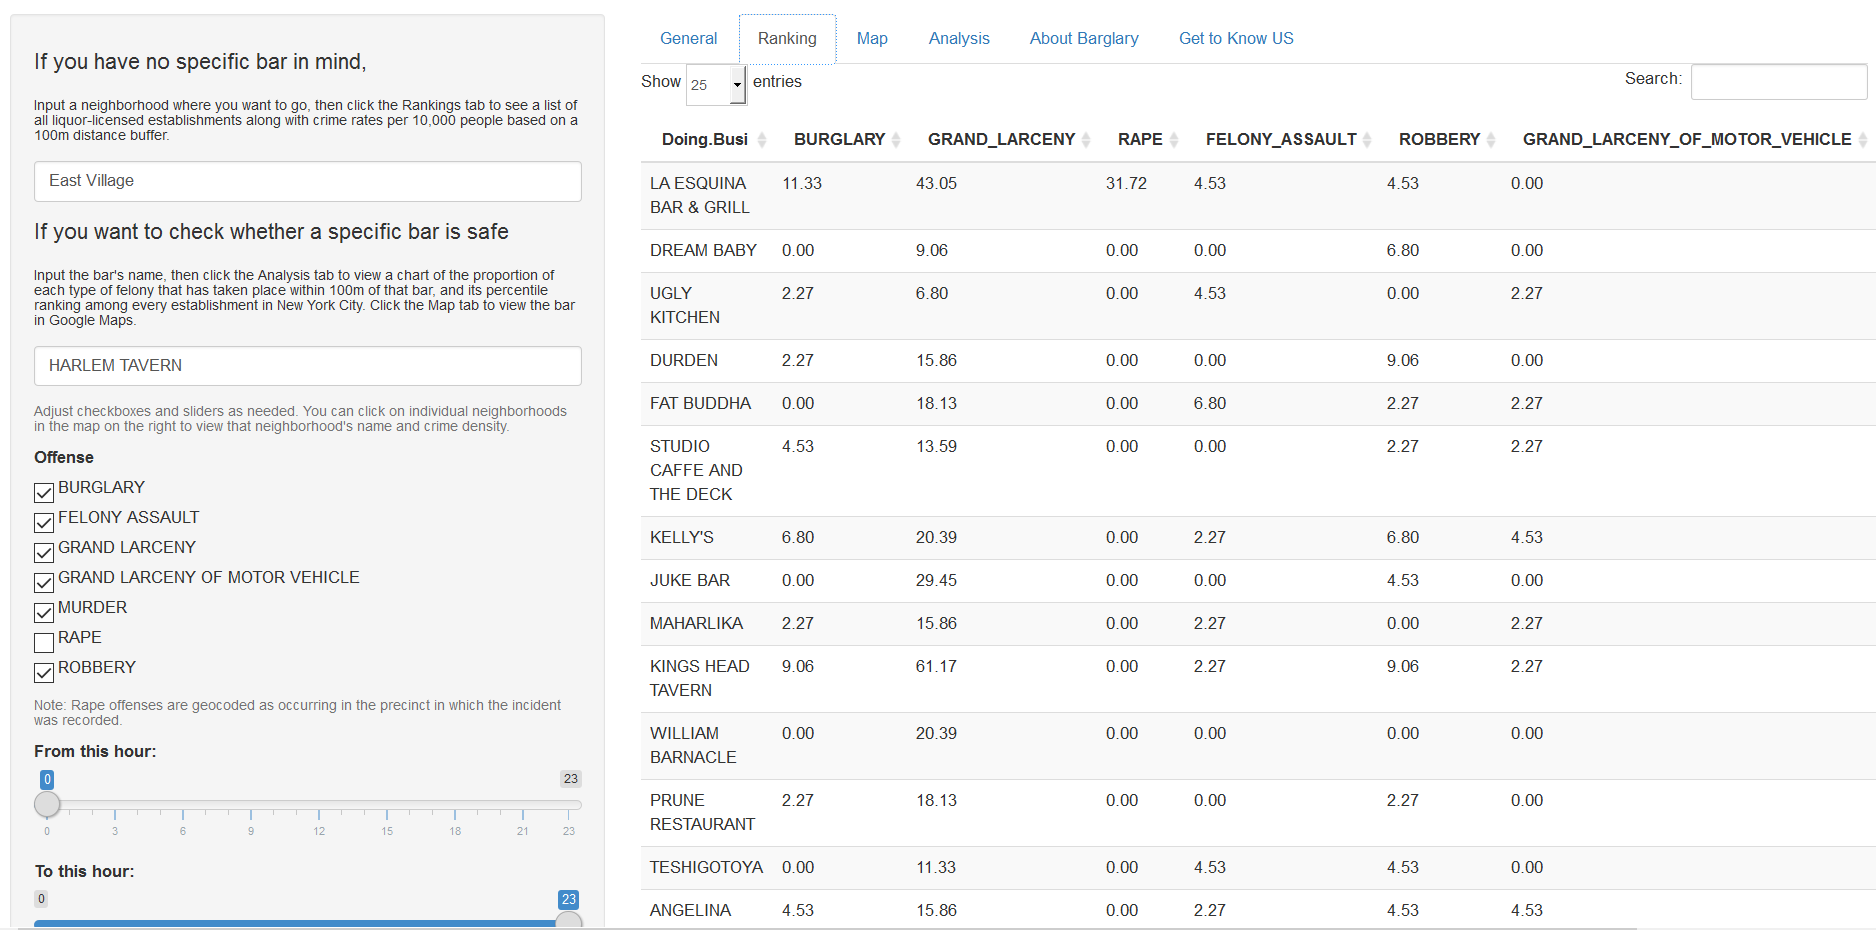
- Search for and rank all liquor-licensed establishments within a neighborhood by crime prevalence.
- Search for a specific bar and view the most prevalent types of crimes and a percentile rank for that bar compared to every other bar in NYC.
- View that specific bar on Google Maps.
This project was developed by Aoyuan Liao, Haoyang Chen, Rong Wang, Yanran Wang, and Arnold Lau (myself) for the Applied Data Science class offered Spring 2016 at Columbia University.


