You can use the scripts in this repository to analyse another git repository for metrics such as lead time and open branches. You should clone the repository you wish to analyse, to a local directory before using these scripts. Some of the metrics, require there to be annotated tags on some of the commits.
Using python 3.7 or greater:
pip install -r requirements.txt
There are two scripts for calculating metrics (which may be combined into one soon). To find out how to use them:
python calculate_four_metrics.py --help
python git-metrics.py --help
Throughput metrics will help you to assess the length of your development cycle. That is, how quickly you can get changes that have been committed in version control, deployed and in front of users.
Deployment lead time is defined as the time taken from commit to deploy. In practice you often have more than one commit included in each deployment, so you might want to take an average as well as track the size of the range from oldest to newest. Deploy Interval is the average length of time between deployments.
In order to measure 'throughput' metrics, your repository will need to contain an annotated tag on each commit that was deployed. (Note, git also supports lightweight tags, but these lack any metadata and cannot be used for calculating throughput metrics). The tag needs to have the 'taggerdate' set to be the time the deploy happened. It is also convenient if you can name the deploy tags in such a way as you can write a simple matcher that will filter them out. For example, you could prepend every deployment tag with 'D-' (for 'Deploy'), then filter out all such tags with the fnmatch 'D-*'.
For example, to see all the tags you already have, you could use this command:
git for-each-ref --sort=taggerdate --format '%(refname) %(taggerdate)' refs/tags
If you need to add a deploy tag at a different time than the deployment, but don't want to mess up your metrics, you can set the time of a tag using an environment variable like this:
GIT_COMMITTER_DATE="Thu Jan 11 12:00:00 2019 +0100" git tag -a D-1.1.0 -m"Deployment 1.1.0"
That command will add a tag to the current HEAD commit with name 'D-1.1.0', with a 'taggerdate' set to midday CET on January 11th, 2019.
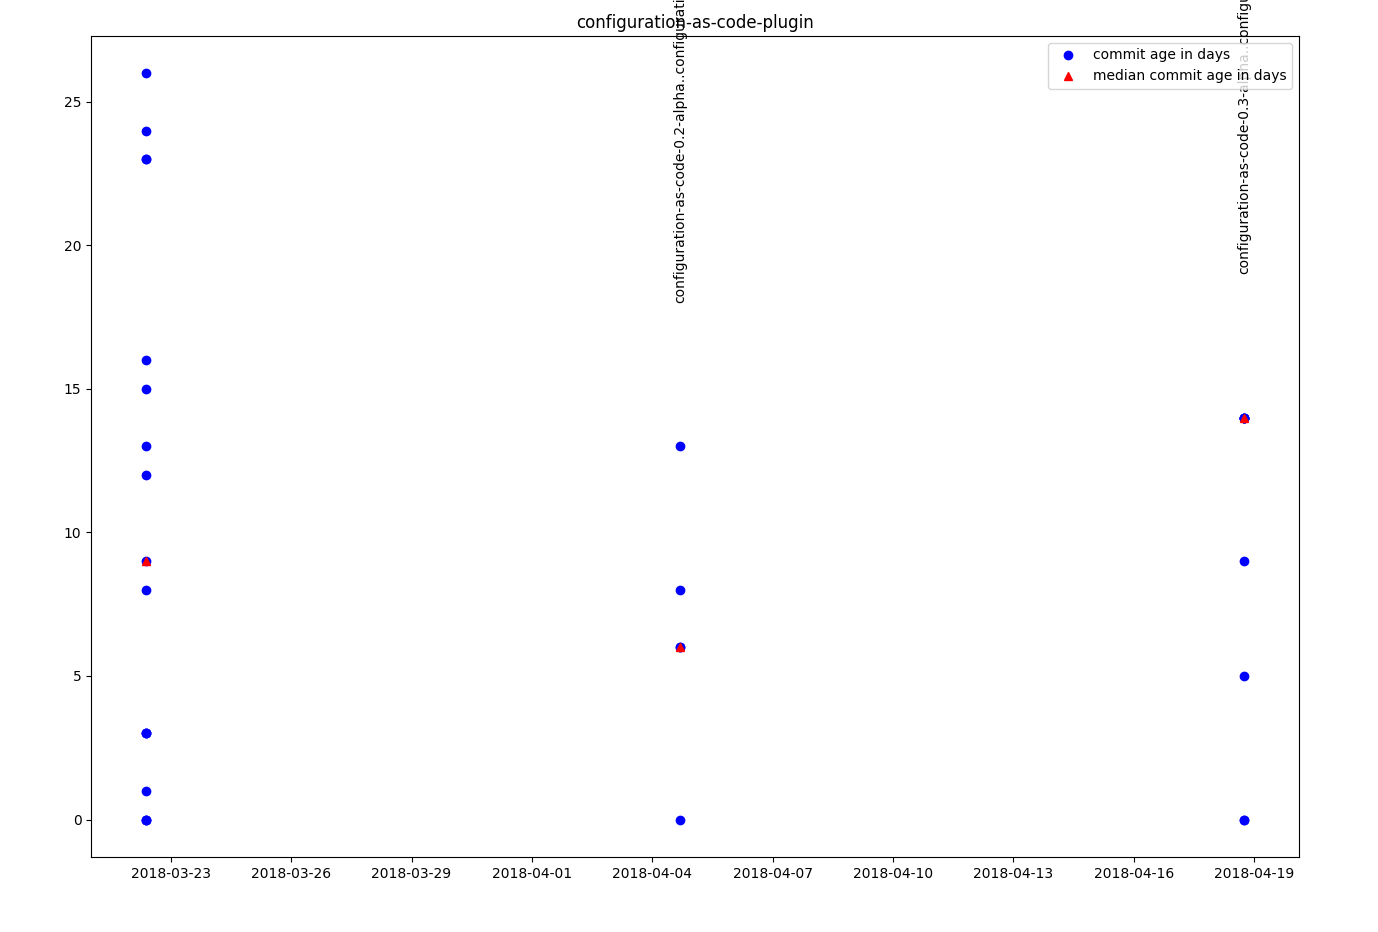
Once you have your repository annotated with tags for each deployment, you can use these scripts to calculate metrics. You might find it helpful to visualize the ages of all the commits in all the deployments in a specific time period. These scripts can produce a graph like this:
Use a command like this to produce the raw data for this graph and store it in a csv file:
python git_metrics.py release-lead-time [--tag-pattern=<fn_match>] [--earliest-date=<timestamp>] <path_to_git_repo> > repo_data.csv
You can then plot this data with this command:
python git_metrics.py plot --release-lead-time <csv_file>
You can also print out average values for both release lead time and release interval like this:
calculate_four_metrics.py lead-time [--deploy-tag-pattern=<fn_match>] [--start-date=<timestamp>] <path_to_git_repo>
calculate_four_metrics.py deploy-interval [--deploy-tag-pattern=<fn_match>] [--start-date=<timestamp>] <path_to_git_repo>
For more information about how to install these scripts, see below under 'Installation'
Stability metrics will help you assess how successful you are at avoiding bugs and having your service available for users. That is, how often do you need to patch your software, and how rapidly can you do so when needed.
Mean time to Recover is defined in these scripts as the time from when a bad deployment is made, until this is corrected via deployment of a patch. Change fail rate is defined as the proportion of deployments that are patches.
In order to measure 'stability' metrics, your repository will need to contain an annotated tag on each deployed commit that was a patch. (Note, git also supports lightweight tags, but these lack any metadata and cannot be used for calculating stability metrics). The tag needs to point at a commit that also has a 'deploy' tag as described in the previous section. The date of the patch tag is not significant. It is convenient if you can name the patch tags in such a way as you can write a simple matcher that will filter them out. For example, you could prepend every patch tag with 'P-' (for 'Patch'), then filter out all such tags with the fnmatch 'P-*'.
If you want to add a patch tag to a commit that has been deployed, and already has the tag 'D-1.1.1', you could do it like this:
git checkout D-1.1.1
git tag -a P-1.1.1 -m"Patch with version 1.1.1"
You can also print out average values for both mean time to recover and change failure rate like this:
calculate_four_metrics.py recovery-time [--deploy-tag-pattern=<fn_match>] [--patch-tag-pattern=<fn_match>] [--start-date=<timestamp>] <path_to_git_repo>
calculate_four_metrics.py change-fail-rate [--deploy-tag-pattern=<fn_match>] [--patch-tag-pattern=<fn_match>] [--start-date=<timestamp>] <path_to_git_repo>
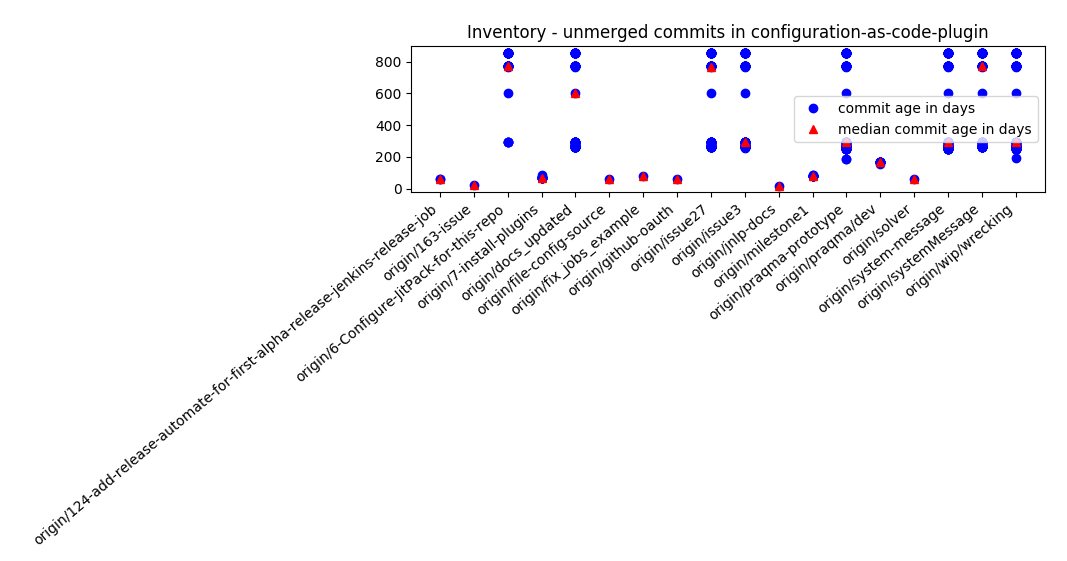
Open branches gathers information about the age of all commits in a branch that is not yet merged into the master branch. This can help visualize how much value is not yet integrated into the project, or the potential merge cost of all code that is not yet shared between developers.
Use these script commands to produce this kind of graph:
git_metrics.py open-branches [--master-branch=<branch>] <path_to_git_repo> > my_repo.csv
git_metrics.py plot --open-branches my_repo.csv
Requirement: Python 3.7 or later
To install dependencies:
pip install -r requirements.txt
for more help run:
python git_metrics.py --help
Those OS with Python 2 as default, e.g. Ubuntu 17/16, you need to use pip and python explicitly if you didn't change the default:
Call the script with:
python3 git_metrics.py --help
Install pip3 if not already installed and configure dependencies with pip3, e.g. Ubuntu 16/17:
sudo apt-get install python3-pip
pip3 install -r requirements.txt
On Ubuntu you might also miss the python3-tk package if doing plots
sudo apt install python3-tk
Call script with
python3 git_metrics.py --help
which will show basic usage information like:
Calculate age of commits in open remote branches

Usage:
    git_metrics.py open-branches [--master-branch=<branch>] <path_to_git_repo>
    git_metrics.py open-branches [--master-branch=<branch>] --plot <path_to_git_repo>
    git_metrics.py release-lead-time [--tag-pattern=<fn_match>] [--earliest-date=<timestamp>] <path_to_git_repo>
    git_metrics.py release-lead-time --plot [--tag-pattern=<fn_match>] <path_to_git_repo>
    git_metrics.py plot --open-branches <csv_file>
    git_metrics.py plot --release-lead-time <csv_file>
    git_metrics.py batch --open-branches <path_to_git_repos>...
    git_metrics.py batch --release-lead-time [--earliest-date=<timestamp>] <path_to_git_repos>...
    git_metrics.py (-h | --help)

    Options:
        --master-branch=<branch>    example: origin/gh-pages
--plotparameter will open a GnuPlot plot, and will not will not save your data.- To save data use without plot and pipe to file for csv format:
git_metrics.py release-lead-time <path_to_git-repo> > my-csv-file.csv - Use plot command to plot existing csv files, e.g.
git_metrics.py plot --release-lead-time my-csv-file.csv batch(undocumented)
Run the self-tests using pytest:
pytest -v

