Introduction
This project is aim to analyse student performance and enrolment. We have collected raw data from students based on their previous grades. The project has two parts, one is system will classify Grades into two catageories Good or Bad using Sciket learn with the help of Machine learning techniques, and in second part we visualize the pre-processed data using D3.js.
Analysis of Student Data
- Subject wise performance
- Sub-continent wise enrolment analysis
- Department wise analysis
- Analysis of source of Study
- Prediction of Good or Bad Grades ( In Mainly Machine Learning part)

Algorithm for Analysis
- Logistic Regression
- KNeighbours Classifier
- Random Forest Classifier
- SVC(Support Vector Classifier)
Libraries and Tools for Analysis
- Sciket learn using Python
- Libraries: Pandas, numpy


Tools for Visualization
- D3.js
- Node.js


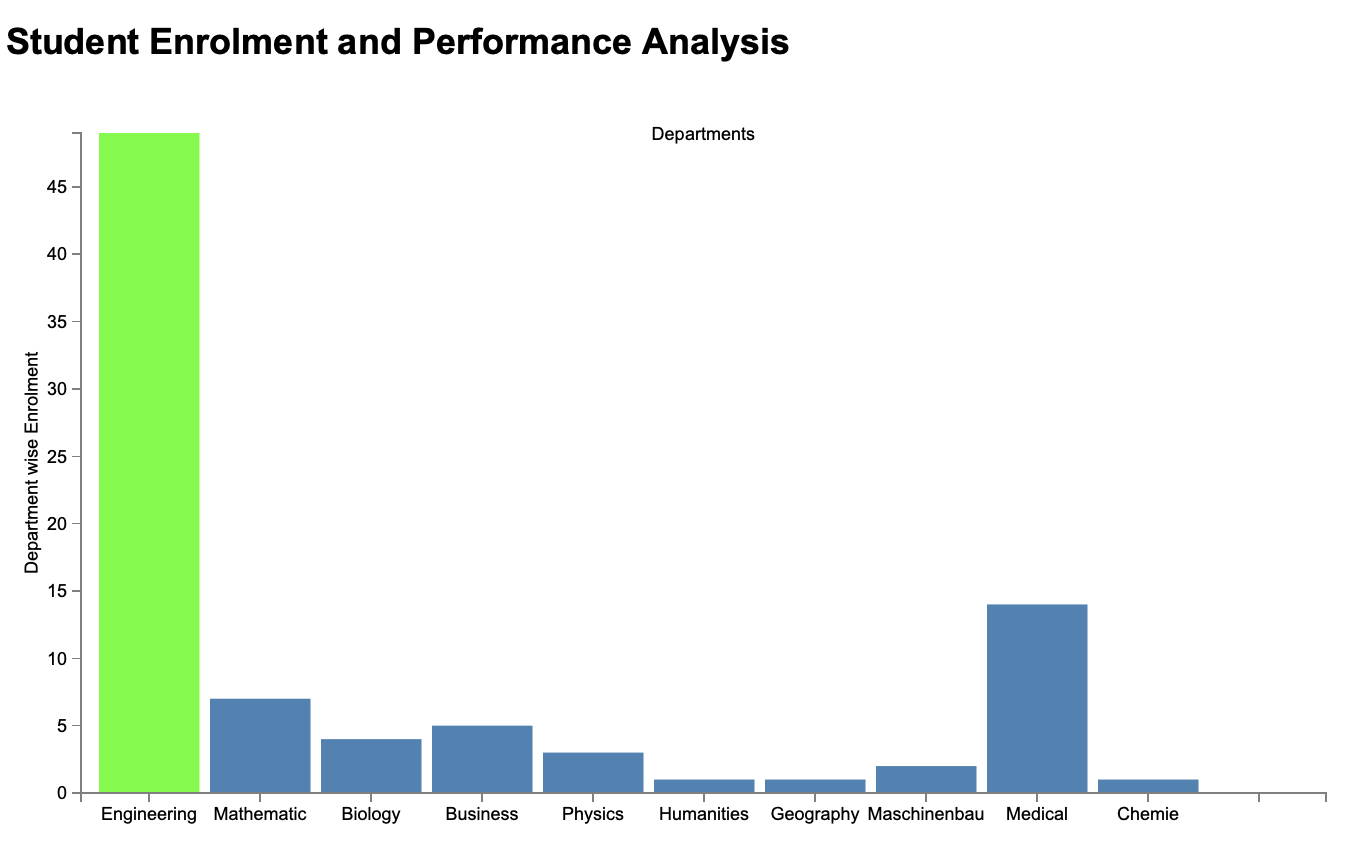
Simple Bar Charts
-
Department wise Enrollment Analysis
-
Country wise Enrollment analysis

-
Sub-Continent wise Enrollment Analysis

-
Learning Resource

Interactive Bar Charts
-
Department wise Student Enrollment Analysis for year 2019

-
German Student Analysis

-
Internationl Students Analysis

-
Grade Average for each Department

Installation for Machine learning
Install python with jupyter Notebook and as well as the libraries Pandas and Numpy
If you are Mac or Linux user, you can use the commands, otherwise follow the links for each installations
-
Python 2.7 - Download it
-
Pip - On linux or mac "pip install -U pip" for windows "python -m pip install -U pip"
-
NumPy 1.6.1 - pip install numpy
-
SciPy 0.9 -pip install scipy
-
Pandas - pip install pandas
-
scikit-learn -pip install sciket-learn
Installing Jupyter using Pip
Open command Terminal and write down these commands
- python -m pip install --upgrade pip
- python -m pip install jupyter
Here are the links
After Installing it, Open Terminal and type "Jupyter Notebook " if its works Congratulations you have installed sucessfully
How to Run
-
Clone our project folder , specially the "LA_project_grades_analysis.ipynb" file and "final_data.tsv"
-
Open Terminal and write Jupyter Notebook, and then open the "LA_project_grades_analysis.ipynb"
-
Set your path for Dateset with name "final_data.tsv"
-
Run it line by line
Installation for Visualization
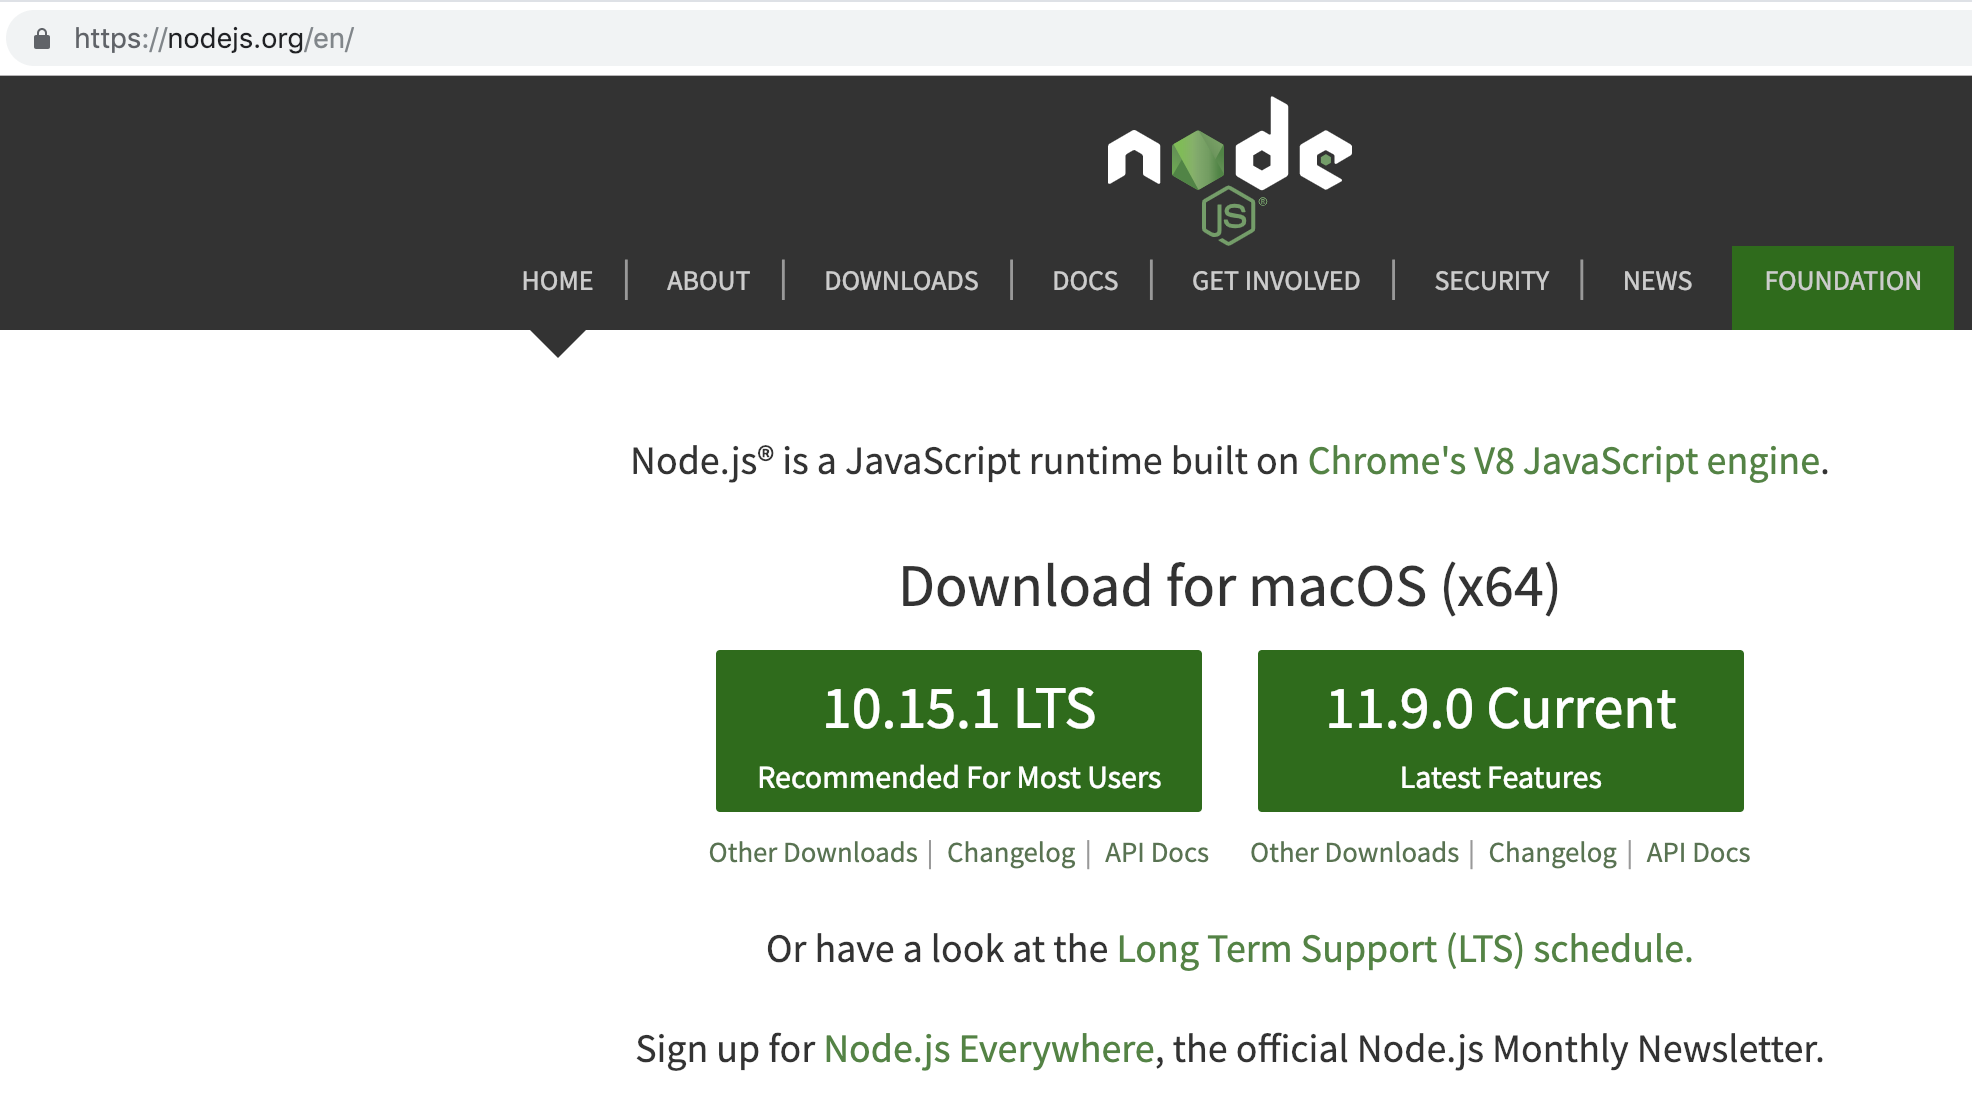
First make sure you have node installed , if you do not have installed then go to official Node web page and download the latest version.
write these command to check Node and NPM is properly installed
- For Node.js "node --version "
- For NPM "npm --version "
After Installing Node, download the D3.Js librray , if you want to start with a new project

How to Run
Clone our project and open the one of the visualization folder
To Run it locally, open the terminal in folder where the visualization code reside, here in the case we have in "Visualization using simple bar charts "
-
write the follwoing commands
- npm install -g http-server
- http-server
-
Server address
Same as for Interactive bar chart folder
- Abdul-Rahman, khan
- A.B.M. Rocknuzzaman
- Piush, Aggarwal
- Amin, Shahin
- Tianyu, Zhu
- Muhammad, Zeeshan
- Ghulam Dawood Nasimi
Special Thanks to SOCO TEAM
- This project was not possible without the help and motivition of Prof. Dr. Mohamed Amine Chatti and Dr. Arham Muslim
We are very thankful to Prof. Dr. Mohamed Amine Chatti and Dr. Arham Muslim
- For providing us such a platform to learn the theoritical concept as well as the practical skills
- To improve communication, presentation ,theoritical and practical skills
- And having the oppurtunity to Brainstorm ideas during workshops and as well as have the chance to work with globally minded students
- This project was the part of Learning Analytics course in UDE
1.0