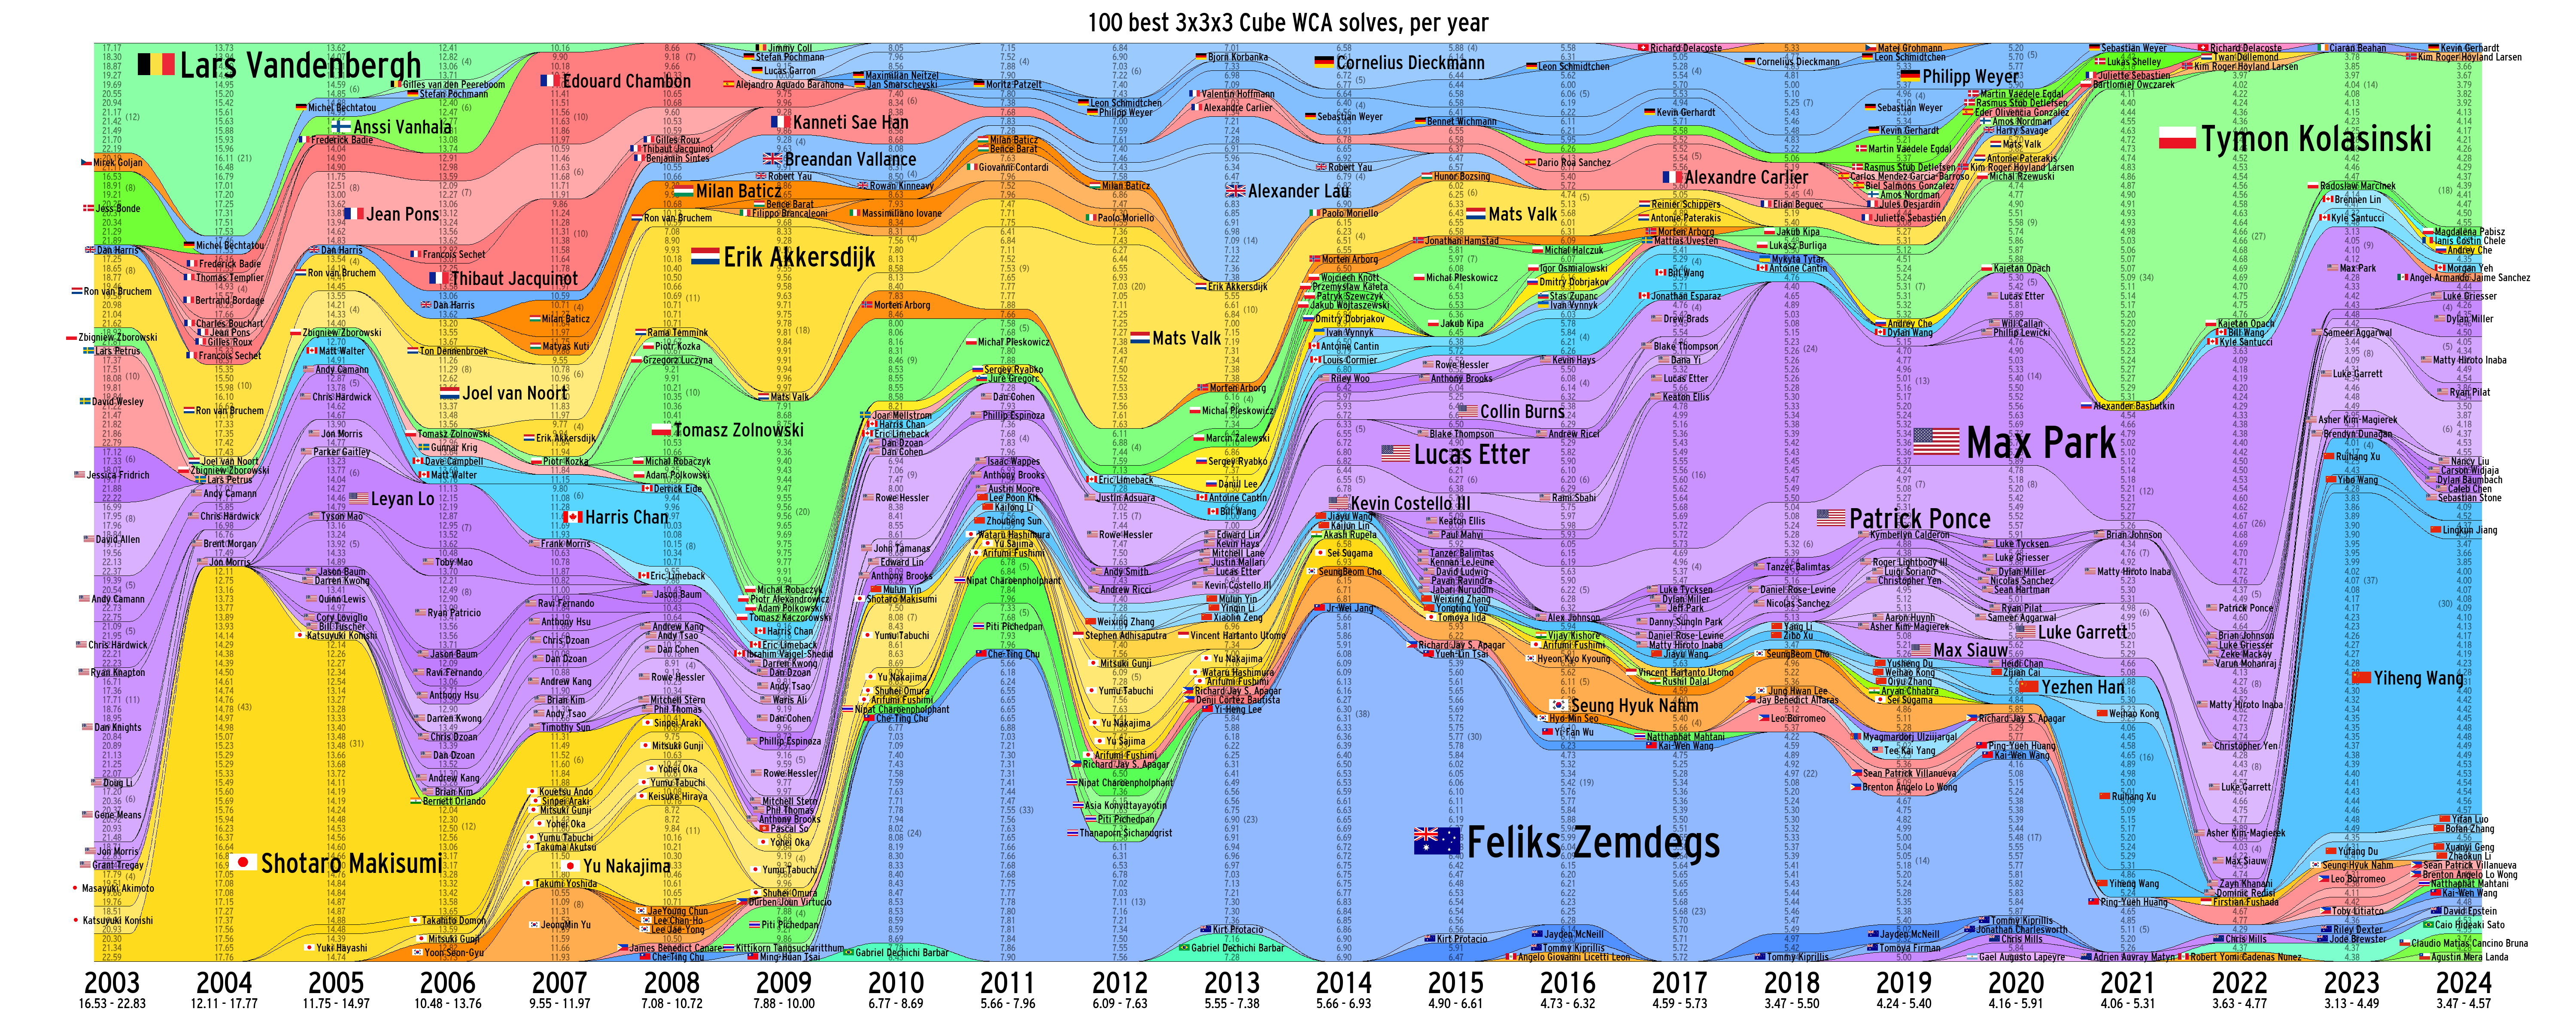
Creates a Stacked Area Chart of the 100 best WCA results of an event, per year!
-
- Download this repo.
-
- Download the most recent WCA .tsv export from here (https://www.worldcubeassociation.org/export/results), extract the .zip, and put the files in the /data folder.
-
- Extract the flags.zip folder. (Set the destination to YOUR_PROJECT_FOLDER/flags, so that the flag images are in the /flags folder!)
- Run this command to install the required libraries (it's just numpy, unidecode, and Pillow, which you may already have):
pip install -r requirements.txt
-
- Open a command prompt from this directory.
-
- Run this command, which will create a simplified .csv data file! (Takes 5 seconds on my computer)
python create_top100.py 333 -
- If you ever have a .csv data file, then run this command to produce the final image: (Takes 0.8 seconds on my computer)
python create_graph.py 333 -
- Voila! The image should show up in your folder as "SAC_graph_333.png".
You can change the event to whatever you want. In these examples, it's 333. But you can also choose from this list (taken from WCA_export_Events.tsv):
222, 333, 333bf, 333fm, 333ft, 333mbf, 333mbo, 333oh, 444, 444bf, 555, 555bf, 666, 777, clock, magic, minx, mmagic, pyram, skewb, sq1
If you want to make a chart for averages, not singles, simply append "_a" to the end of the event parameter, like so:
python create_top100.py 333_a
I wrote this code in a couple days, so the text might not show up correctly with the oddball events, like FMC or Multi-Blind.
