In layperson terms, metrics are numeric measurements. Time series means
that changes are recorded over time. What users want to measure differs
from applications. For a web server it might be request
time, for a database it might be number of active connections or number
of active queries etc.
Metrics play an important role in understanding why your application is
working in a certain way. Let’s assume you are running a web application
and find that the application is slow. You will need some information to
find out what is happening with your application. For example the
application can become slow when the number of requests are high. If you
have the request count metric you can spot the reason and increase the
number of servers to handle the load.
https://prometheus.io/docs/introduction/overview/
An event is a conceptual abstraction and a structured log is one possible representation of that abstraction. The interesting part of the conversation is where to draw the lines around that abstraction, the technical implementation part is how to represent that event.

A trace is a collection of operations that represents a unique
transaction handled by an application and its constituent services. A
span represents a single operation within a trace.
A trace is the complete processing of a request. The trace represents
the whole journey of a request as it moves through all of the services
of a distributed system.
Trace is often visualized using a hierarchical bar chart. Similarly to
how Gantt charts represent subtask dependencies and durations in a
project, a distributed trace represents dependencies and duration of
different microservices processing the request.

-
Trace exposes the execution path through a distributed system. Trace is composed of one or more spans.
-
Span in the trace represents one microservice in the execution path. For instance, a credit score check could be a span in a trace of a loan application processing. Spans can create multiple child spans, and every child span has exactly one parent span.
For the pull approach, the monitoring targets will not send anything to the monitoring server. The server will “ask” the targets for the metrics. For example Prometheus as a pull approach and is requesting the targets with http.
The pull approcah consists of making the target sending their metrics to the monitoring server. In the Prometheus case, if a target doesn’t support pull but only push, we can use the “pushgateway” as an intermediate.
In the Prometheus architecture, service discovery (SD) consists as a best practice to improve the scalability/maintainability of the infrastructure. Define your jobs in the prometheus config file and your instances list for SD in exeternal files. The advantages of defining instances in a separate file is that you can add once while prometheus is running without the need of reload the config file.


The Prometheus ecosystem consists of multiple components, many of which are optional:
-
the main Prometheus server which scrapes and stores time series data
-
client libraries for instrumenting application code
-
a push gateway for supporting short-lived jobs
-
special-purpose exporters for services like HAProxy, StatsD, Graphite, etc
-
an alertmanager to handle alerts
-
various support tools
Most Prometheus components are written in Go, making them easy to build and deploy as static binaries.
Config file written in yaml so quite easy to read and understand. After the “global” key you will find based features like :
-
scrape_interval: periode that will use Prometheus for scraping the targets (1mn by default)
-
evaluation_interval: periode that will use Prometheus to check the rule file for the alerting part
-
scrape_timeout: periode that will use Prometheus to determine if a target is unreachable
-
rule_files: path of the file were we defined the rules for the triggers
-
alerting: the url and the port to send PUSH request to alertmanager that will send notifications
-
scrape_configs: the configuration of the jobs and the instances

Prometheus values reliability. You can always view what statistics are
available about your system, even under failure conditions. If you need
100% accuracy, such as for per-request billing, Prometheus is not a good
choice as the collected data will likely not be detailed and complete
enough. In such a case you would be best off using some other system to
collect and analyze the data for billing, and Prometheus for the rest of
your monitoring.
In addition, Prometheus can’t store logs, you will need te use some
others tools like Promtail + Loki.
Prometheus fundamentally stores all data as time series: streams of
timestamped values belonging to the same metric and the same set of
labeled dimensions. Besides stored time series, Prometheus may generate
temporary derived time series as the result of queries.
Prometheus is storing the data with a “key:value” reference. Here it’s a
timestamp (with a millisecond precision) associated with a value.
https://prometheus.io/docs/concepts/data_model/
Every time series is uniquely identified by its metric name and optional
key-value pairs called labels.
The metric name specifies the general feature of a system that is
measured (e.g. http _requests_total - the total number of HTTP requests
received). It may contain ASCII letters and digits, as well as
underscores and colons. It must match the regex
[a-zA-Z_:][a-zA-Z0-9_:]*.
Labels enable Prometheus’s dimensional data model: any given combination
of labels for the same metric name identifies a particular dimensional
instantiation of that metric (for example: all HTTP requests that used
the method POST to the /api/tracks handler). The query language allows
filtering and aggregation based on these dimensions. Changing any label
value, including adding or removing a label, will create a new time
series.
Label names may contain ASCII letters, numbers, as well as underscores.
They must match the regex [a-zA-Z_][a-zA-Z0-9_]*. Label names
beginning with __ are reserved for internal use.
Label values may contain any Unicode characters.
A label with an empty label value is considered equivalent to a label
that does not exist.
For example, a time series with the metric name
api_http_requests_total and the labels method="POST" and
handler="messages" could be written like this:
api_http_requests_total{method="POST", handler="messages"}
For the http exposition, today metrics could be exposed with 2 ways.
-
Text-format : first created way to expose metrics to Prometheus just via plain text lines
-
OpenMetrics : OpenMetrics want to indroduce some standardisation in the exposition of the metrics, still in developpment
https://github.com/prometheus/docs/blob/main/content/docs/instrumenting/exposition_formats.md
-
Counter : A counter is a cumulative metric that represents a single monotonically increasing counter whose value can only increase or be reset to zero on restart. For example, you can use a counter to represent the number of requests served, tasks completed, or errors.
Do not use a counter to expose a value that can decrease. For example, do not use a counter for the number of currently running processes; instead use a gauge. -
Gauge : A gauge is a metric that represents a single numerical value that can arbitrarily go up and down.
Gauges are typically used for measured values like temperatures or current memory usage, but also "counts" that can go up and down, like the number of concurrent requests. -
Histogramm : A histogram samples observations (usually things like request durations or response sizes) and counts them in configurable buckets. It also provides a sum of all observed values.
-
Summary : Similar to a histogram, a summary samples observations (usually things like request durations and response sizes). While it also provides a total count of observations and a sum of all observed values, it calculates configurable quantiles over a sliding time window.
https://prometheus.io/docs/concepts/metric_types/

-
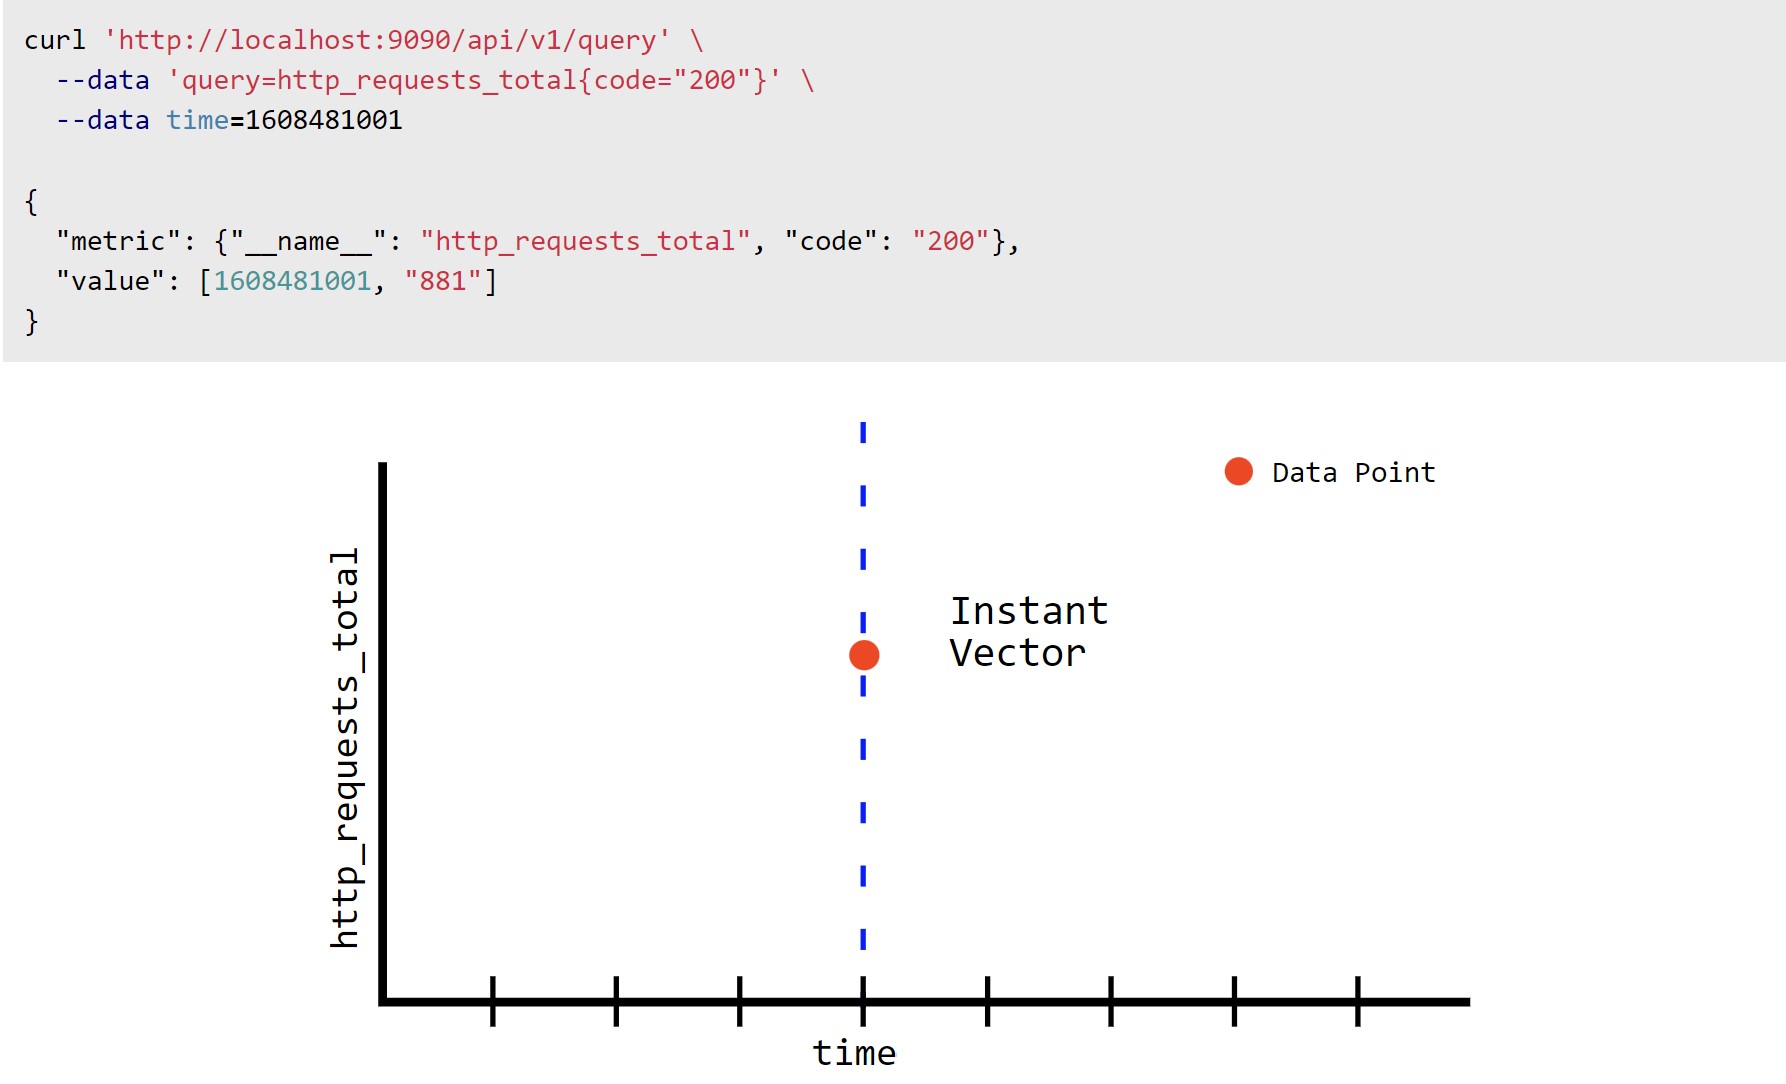
Instant vector :
-
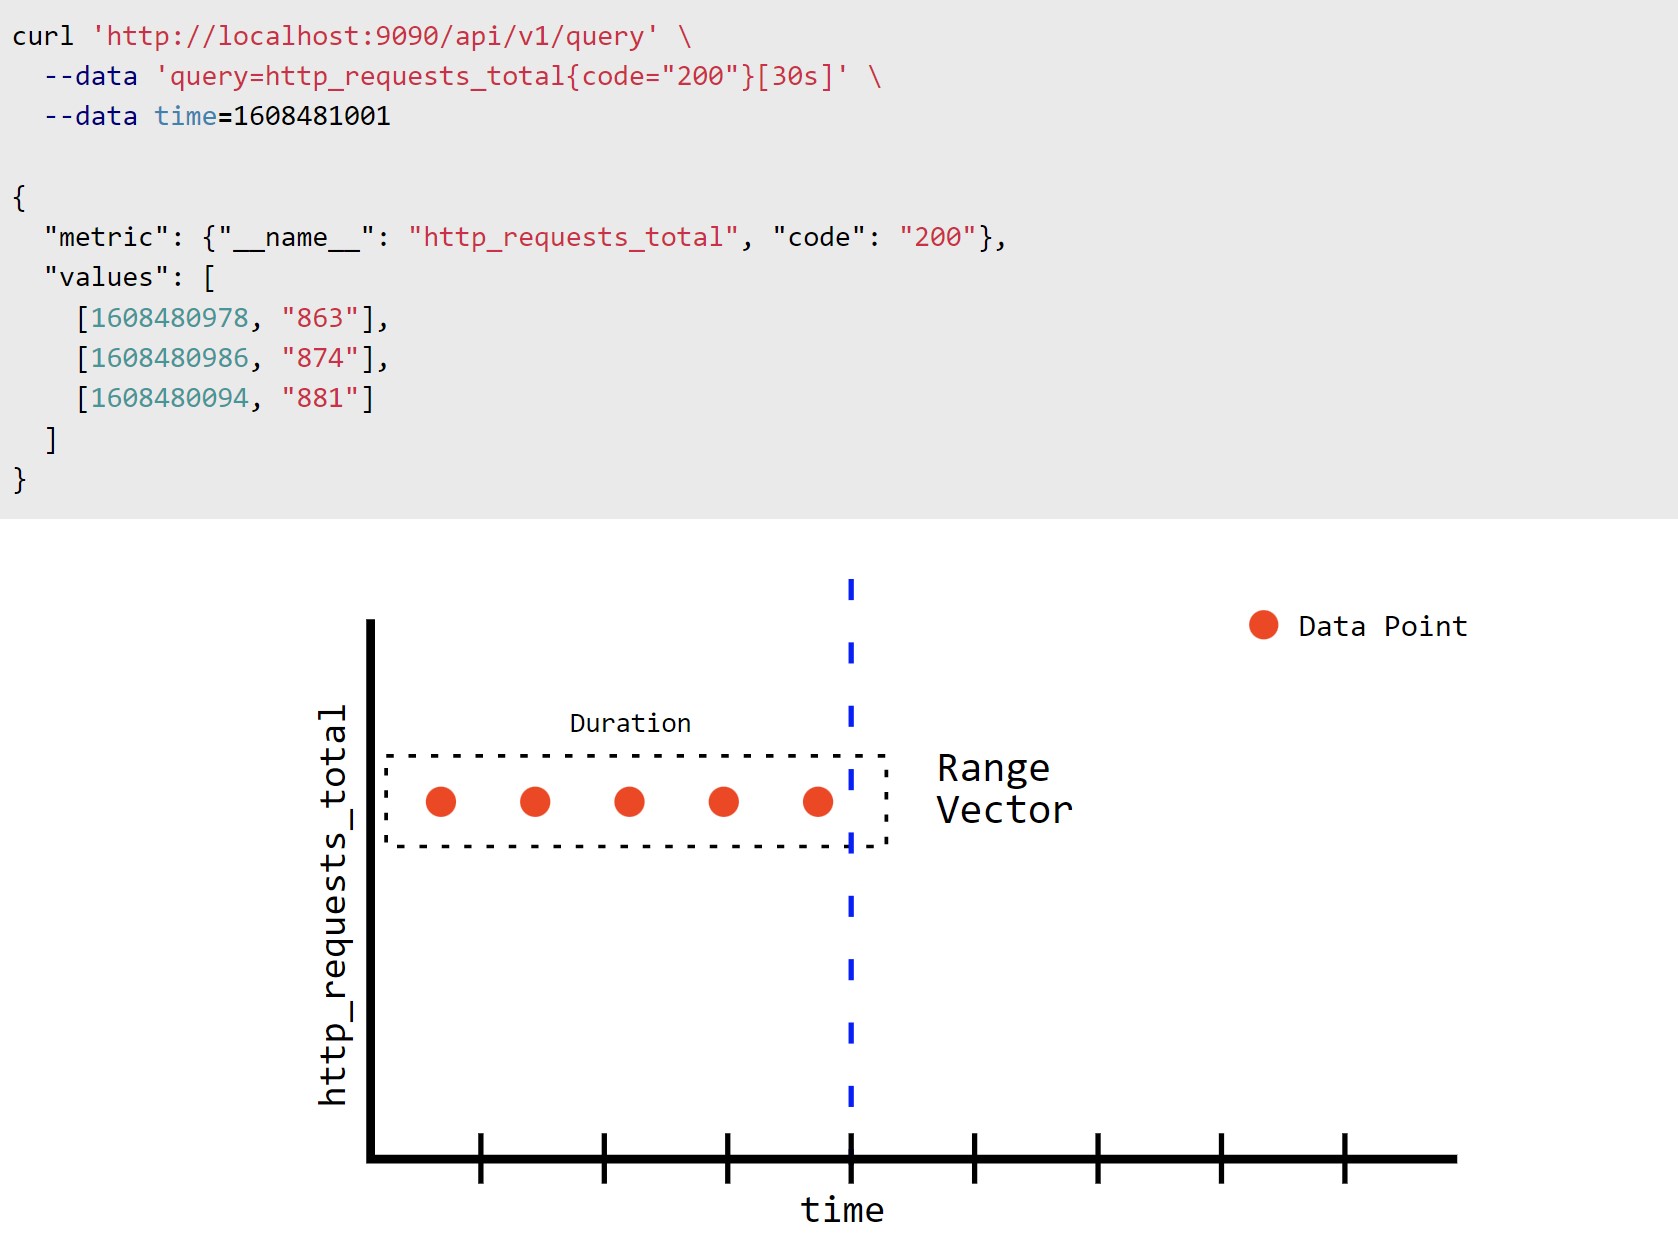
Range vector :


https://satyanash.net/software/2021/01/04/understanding-prometheus-range-vectors.html
The “rate” function of Prometheus use the “variation rate” formula that
we know as below :
(f(a+h)−f(a))/h
It’s using the range vector that we saw earlier, you can have an
estimation about the metric “x” is evolving in the time. You can use it
like this :
rate[1m] = (count at 2m - count at 1m) / 60 = (4423 - 4381) / 60 =
0.7
Rate could be usefull to saw how fast a metric is evolving but it’s
only available for counters, not for gauges.
Derivative, in monitoring, allow us to see how a metric is evolving per second. It’s quite similar to rate but we will use derivative function with gauges metrics only.
This X_over_time(Y) function is usefull to compare multiple range vectors. It will compare range vectors on se same interval and returning an instant vector.

On the example below, we could imagine a series named temperature_instant with 2 different value of the label {instance}. {instance=”A”} and {instance=”B”} respectively blue and red colors. We want to know the average temperature (not just a simple delta between the first and last value) during a period of 5mn. By using avg_over_time(temperature_instant[5m]) we will get :
-
{instance=”A”} : 45
-
{instance=”B”} : 15

Temporal aggregations do not retain the metric name in the result.
It will aggregate the value of the different series.
https://iximiuz.com/en/posts/prometheus-functions-agg-over-time/
This section concern the aggregation operator. It’s a serie of fonction
that allows you to do some operations on a value of a metric. Thoose
operators are only working with instant vectors, not range
vectors.
Under this you can find a list of the aggregation operators privided by
the official documentation :
-
sum (calculate sum over dimensions)
-
min (select minimum over dimensions)
-
max (select maximum over dimensions)
-
avg (calculate the average over dimensions)
-
group (all values in the resulting vector are 1)
-
stddev (calculate population standard deviation over dimensions)
-
stdvar (calculate population standard variance over dimensions)
-
count (count number of elements in the vector)
-
count_values (count number of elements with the same value)
-
bottomk (smallest k elements by sample value)
-
topk (largest k elements by sample value)
-
quantile (calculate ϕ-quantile (0 ≤ ϕ≤ 1) over dimensions)
We can add words after the request like or, without to sort the
result with a label value like this :
<aggr-op> [without|by (<label list>)] ([parameter,] <vector
expression>)
or
([parameter,] <vector expression>) [without|by (<label
list>)]
Aggregation over dimension will look at the the sample of different
series with an instant vector.
Prometheus’s query language supports basic logical and arithmetic operators. For operations between two instant vectors, the matching behavior can be modified.
To do some requests, Prometheus allows you to make some operations between scalar/scalar, vector/scalar, and vector/vector value pairs. Like bellow :
-
-
−
-
*
-
/
-
%
The following trigonometric binary operators, which work in radians,
exist in Prometheus:
atan2 (based onhttps://pkg.go.dev/math#Atan2)
Trigonometric operators allow trigonometric functions to be executed on
two vectors using vector matching, which isn’t available with normal
functions. They act in the same manner as arithmetic operators.
-
= =
-
!=
-
>
-
<
-
> =
-
< =
-
and (intersection)
-
or (union)
-
unless (complement)
-
*, /, %, atan2
-
+, -
-
= =,!=, < =,<, > =,>
-
and, unless
-
or
Histogram is a specific type of metric, you can see bellow a two-dimension representation :

Prometheus application of histograms is a little bit different than this example.
-
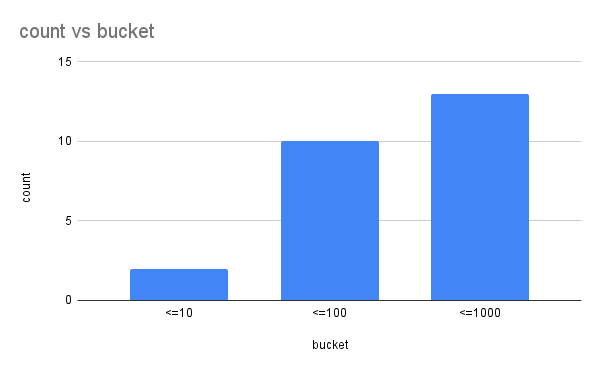
Each bucket is cumulative, the value will always increase. The same example from a Prom view will give that :
-
Histograms values are composed of buckets (blue rectangle on the picture). Each bucket is composed of different values count inferior or equal to the bucket value.


An histogram metric includes 3 items:
-
A counter with the total number of measurements. The metric name uses the _count suffix.
-
A counter with the sum of the values of all measurements. The metric name uses the _sum suffix.
-
The histogram buckets are exposed as counters using the metric name with a _bucket suffix and a le label indicating the bucket upper inclusive bound. Buckets in Prometheus are inclusive, that is a bucket with an upper bound of N (i.e., le label) includes all data points with a value less than or equal to N.
https://www.timescale.com/blog/four-types-prometheus-metrics-to-collect/ https://prometheus.io/docs/practices/histograms/ https://andykuszyk.github.io/2020-07-24-prometheus-histograms.html https://medium.com/mercari-engineering/have-you-been-using-histogram-metrics-correctly-730c9547a7a9
Timestamp is a int64 number in millilsecond used to store and reference the metric in the TSDB. Each sample/value in Prometheus is stored with a value and a timestamp. https://prometheus.io/docs/concepts/data_model/
Before you can monitor your services, you need to add instrumentation to
their code via one of the Prometheus client libraries. These implement
the Prometheus metric types.
Choose a Prometheus client library that matches the language in which
your application is written. This lets you define and expose internal
metrics via an HTTP endpoint on your application’s instance:
-
Go
-
Java or Scala
-
Python
-
Ruby
-
Rust
Instrumentation is a best practice that advise you to make all of your
applications exposing their own metrics. Like this, you could easily
monitor your programms and have a look on the activities of your code.
You can use the Prometheus libraries for the langage that you use.
Exporter are little servers that will find and expose metrics on an http port. Prometheus will scrape the metrics expose by the exporter to put it in it’s TSDB. It’s usefull because if an exporter exist for the application or service that you want to minitor, you can quickly add this to your Prometheus supervision.
There are some “official” exporters on the Github page of Prometheus.
But not enougth for everything. So there is a lot of “third-party”
exporters written by the community. Some can help you to monitor your
systems.
For example : https://github.com/arthur-ehrle/nsx-exporter
If you have a new need for a Prometheus monitoring, you can write your
Prometheus exporter by using the libaries that we mentionned before.
You can refered to the best practives given by the Prometheus
documentation
https://prometheus.io/docs/instrumenting/writing_exporters/
There is some best pratices to follow when you create your own metrics.
https://prometheus.io/docs/instrumenting/writing_exporters/#naming
Generally metric names should allow someone who is familiar with
Prometheus but not a particular system to make a good guess as to what a
metric means. A metric named http_requests_total is not extremely
useful - are these being measured as they come in, in some filter or
when they get to the user’s code? And requests_total is even worse, what
type of requests?
With direct instrumentation, a given metric should exist within exactly
one file. Accordingly, within exporters and collectors, a metric should
apply to exactly one subsystem and be named accordingly.
Metric names should never be procedurally generated, except when writing
a custom collector or exporter.
Metric names for applications should generally be prefixed by the
exporter name, e.g. haproxy_up.
Dashboards acts as the presentation layer for a user. It’s the graph
that you will look frequently to get informations about a system. It has
to be a developped and effective system. Prometheus is not able to be
qualified as a data-visualisation tool. Of course, it has a web gui, but
it’s only usefull to test your PromQL queries. You should use a
third-party tool like Grafana to visualize your data.
There is some recommandations for the creation of your dashboards that
you can find in the official documentation like :
-
Have no more than 5 graphs on a console.
-
Have no more than 5 plots (lines) on each graph. You can get away with more if it is a stacked/area graph.
-
When using the provided console template examples, avoid more than 20-30 entries in the right-hand-side table.
Alerting with Prometheus is separated into two parts. Alerting rules in
Prometheus servers send alerts to an Alertmanager. The Alertmanager then
manages those alerts, including silencing, inhibition, aggregation and
sending out notifications via methods such as email, on-call
notification systems, and chat platforms.
The main steps to setting up alerting and notifications are:
-
Setup and configure the Alertmanager
-
Configure Prometheus to talk to the Alertmanager
-
Create alerting rules in Prometheus
Just under, you can find a configuration example of the alert file from Prometheus.

Prometheus will have a lot of conditions to start a trigger, the expression has to be matched for a certain periode. To write the expression, you have to use PromQL. If time condition is OK, the state will come from “pending” to “active” and send a push request to Alertmanager with some informations, like all the “label” defined in the rule.
Alertmanager isn’t the tool that will create alerts. We saw that this part was handled by Prometheus. Alertmanager is a notifier, it will received triggers and send notifications via some channels inluding informations. It was do that depending on the content of the label alerts that he received.

For example you can define an alert in Prometheus with le label team: NOC-agents and in Alertmanager you can say that the Alerts marked by team: NOC-agents has to be forwarded to an API url to send SMS.
An alarm is a piece of configuration describing a system’s change in
state, most typically a highly undesirable one, through fluctuations of
data points in a timeseries. Alarms are made up of metric monitors and
date-time evaluations and may optionally nest other alarms.
An alert is a notification of a potential problem, which can take one or
more of the following forms: email, SMS, phone call, or a ticket. An
alert is issued by an alarm when the system transitions through some
threshold, and this threshold breach is detected by a monitor. Thus, for
example, you may configure an alarm to alert you when the system exceeds
80% of CPU utilization for a continuous period of 10 minutes.
A metric monitor is attached to a timeseries and evaluates it against a
threshold. The threshold consists of limits (expressed as the number of
data points) and the duration of the breach. When the arriving data
points fall below the threshold, exceed the threshold, or go outside the
defined range for long enough, the threshold is said to be breached and
the monitor transitions from clear into alert state. When the data
points fall within the limits of the defined threshold, the monitor
recovers and returns to clear state. Monitor states are used as factors
in the evaluation of alarm states.