This repository structure a deployment of Zabbix Components (6.0.28), Grafana (9.3.2) and Database (PostgreSQL 13.5) service for network monitoring
Prerequisites Before you begin, ensure you have the following packages installed on your system:
- Git version 2.34.1
- Docker version 24.0.6, build ed223bc
- Docker Compose version v2.21.0
First, copy the line below and paste on your prompt to clone the repository:
git clone https://github.com/arthurcadore/zbx-grafana-appliance
If you don't have installed the package Git yet, do it before try to clone the respository!
Navigate to the project directory:
cd ./zbx-grafana-appliance
If you don't have Docker (and Docker-compose) installed on your system yet, it can be installed by run the following commands (Script for Ubuntu 22.04):
./docker/installDocker.sh
If you had to install docker, please remember to reboot you machine to grant user privileges for docker application.
In sequence, configure the environment variables for the application container, you can do this by edditing the files in the .env_vars:
.POSTGRES_USER -> Change database User
.POSTGRES_PASSWORD -> Change database Password
.env_grafana -> Change Grafana Default 'Admin' password
Run the command below to start docker-compose file:
docker compose up &
The "&" character creates a process id for the command inputed in, with means that the container will not stop when you close the terminal.
Once the container is up and running, you can access the applications web interface at the following addresses:
- Zabbix Web Interface:
http://localhost:8080/index.php
- Zabbix Server/Agent Interfaces:
localhost:10050
localhost:10051
- Grafana:
http://localhost:3000/login
- Database:
pgsql://localhost:5432
- First, access the Grafana web interface at
3000/TCPport:
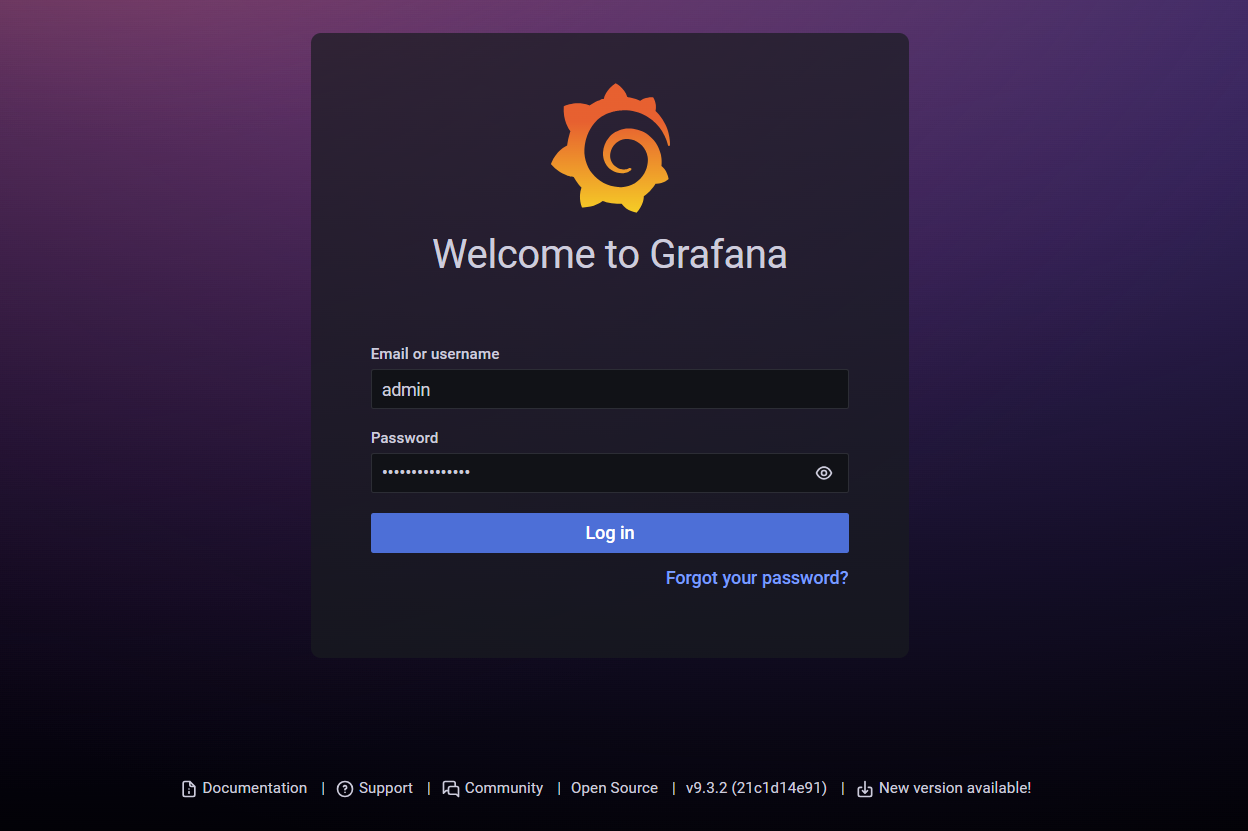
The default user is "admin", the password was configured in .env_grafana file.
-
In the
pluginsection, enable the "Zabbix" plugin for use it. -
In sequence, create a new
data-sourceusing "Zabbix Data Source", in the configuration of it, insert the Zabbix-Web container API access:
On the "Zabbix Connection" parameters, input the user and password of zabbix interface access, which is the following as default:
User: Admin
Password: zabbix
- Finally, use the
save and testbutton to verify if the parameters configurated have allowed the Grafana to consult the Zabbix API, the zabbix will show the following log if the connection was successfully:
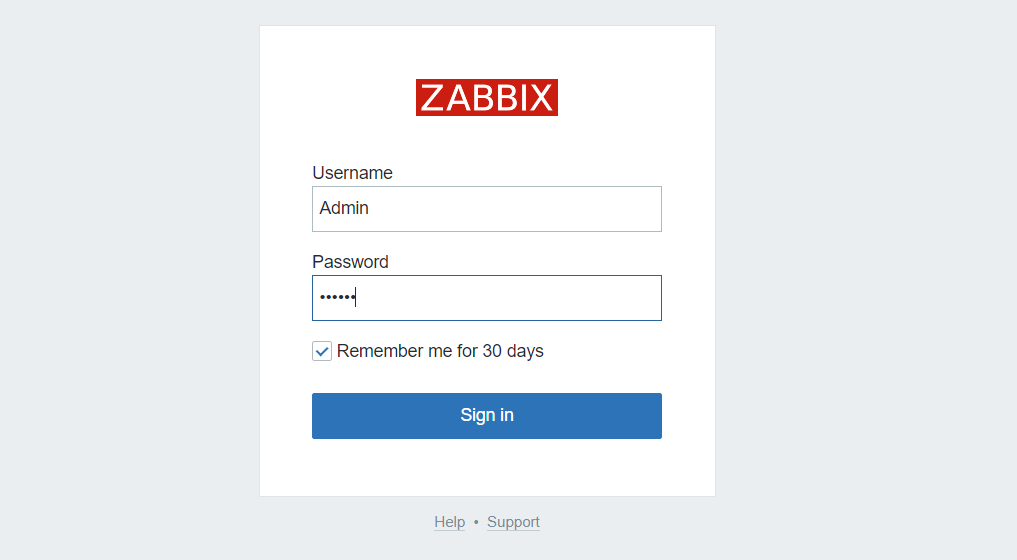
To access the Zabbix web interface, use the 8080/TCP port, with the following credentials:
User: Admin
Password: zabbix
To stop the running container, use the following command:
docker-compose down
This command stops and removes the containers, networks, defined in the docker-compose.yml file.


