Collection of scripts for calculating TTT and CCT diagrams of iron-based alloys using the methods described on the paper by Li et al., 1998.
Feel free to edit the code to, for instance, automatize the generation of diagrams. transformation_models.py contains the models used for calculating the transformation diagrams. Two main classes are defined: Alloy and TransformationDiagrams. Alloy stores the information of the prior austenite grain size and composition, while TransformationDiagrams is used for plotting the TTT and CCT diagrams and phase fraction evolution for a given thermal cycle.
The repository also contains scripts for easy plotting of phase diagrams and phase fraction curves: plot_diagrams.py and plot_phase_fractions.py.
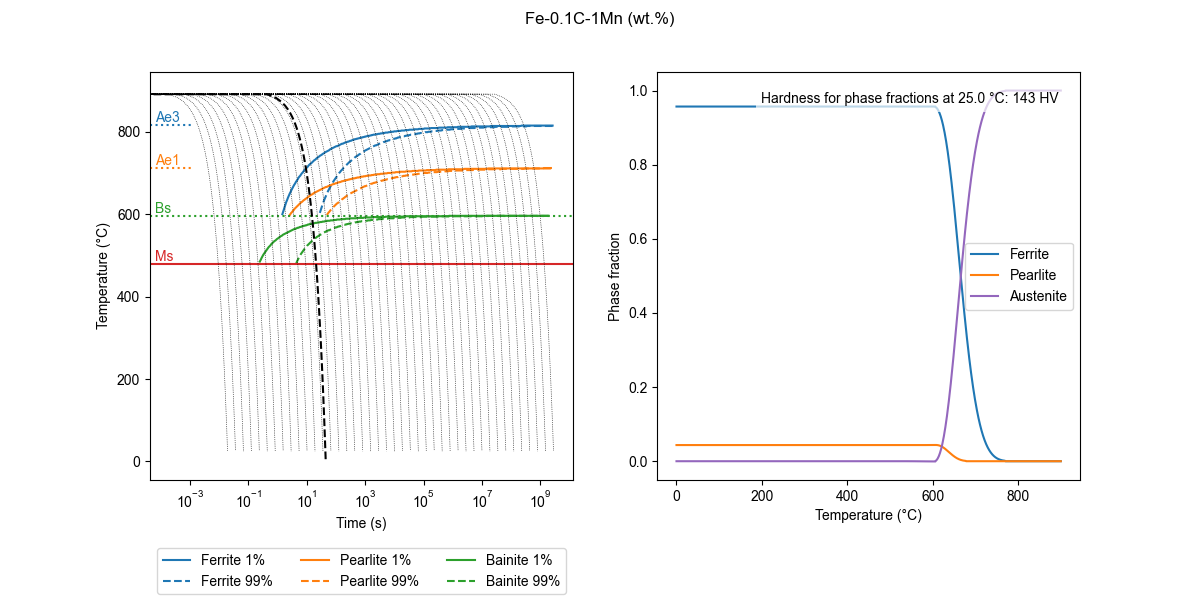
The hardness of the heat treated material is estimated using Maynier et al., 1978 and implemented by Li et al., 1998. When plot_phase_fractions.py is called, the hardness of the final microstructure is displayed on the plot.
DISCLAIMER: Calculation of phase fractions doesn't take into account how a phase transformation affect the austenite composition and therefore might affect the subsequent phase transformations. Use this model at your own risk.
The scripts run in python 2 (>= 2.7) and python 3 (>= 3.5). However, since support for python 2 has reached its end of life in January 2020, it is recommended to run the scripts using python 3. It uses the non standard python libraries argparse, numpy, matplotlib, pandas, and scipy. In most modern python distributions these requirements should be already met in the native instalation, for example Anaconda. Otherwise, you can install dependencies from the Python Package Index using the pip command.
pip3 install numpy matplotlib pandas argparse scipy --userusage: plot_diagrams.py [-h] [-g GS] [-C C] [-Si SI] [-Mn MN] [-Ni NI]
[-Mo MO] [-Cr CR] [-V V] [-Co CO] [-Cu CU] [-Al AL]
[-W W] [-Tini TINI]
Script for plotting TTT and CCT diagrams
optional arguments:
-h, --help show this help message and exit
-g GS, --gs GS ASTM grain size number (default: 7)
-C C, --C C Carbon wt.% (default: 0.0)
-Si SI, --Si SI Silicon wt.% (default: 0.0)
-Mn MN, --Mn MN Manganese wt.% (default: 0.0)
-Ni NI, --Ni NI Nickel wt.% (default: 0.0)
-Mo MO, --Mo MO Molybdenum wt.% (default: 0.0)
-Cr CR, --Cr CR Chromium wt.% (default: 0.0)
-V V, --V V Vanadium wt.% (default: 0.0)
-Co CO, --Co CO Cobalt wt.% (default: 0.0)
-Cu CU, --Cu CU Copper wt.% (default: 0.0)
-Al AL, --Al AL Aluminium wt.% (default: 0.0)
-W W, --W W Tungsten wt.% (default: 0.0)
-Tini TINI, --Tini TINI
Initial continuous cooling temperature (oC) (default:
900.0)
usage: plot_phase_fractions.py [-h] -Tini TINI -t T [-phi PHI] [-g GS] [-C C]
                               [-Si SI] [-Mn MN] [-Ni NI] [-Mo MO] [-Cr CR]
                               [-V V] [-Co CO] [-Cu CU] [-Al AL] [-W W]

Script for plotting phase fraction curves for a given thermal cycle

optional arguments:
  -h, --help            show this help message and exit
  -g GS, --gs GS        ASTM grain size number (default: 7)
  -C C, --C C           Carbon wt.% (default: 0.0)
  -Si SI, --Si SI       Silicon wt.% (default: 0.0)
  -Mn MN, --Mn MN       Manganese wt.% (default: 0.0)
  -Ni NI, --Ni NI       Nickel wt.% (default: 0.0)
  -Mo MO, --Mo MO       Molybdenum wt.% (default: 0.0)
  -Cr CR, --Cr CR       Chromium wt.% (default: 0.0)
  -V V, --V V           Vanadium wt.% (default: 0.0)
  -Co CO, --Co CO       Cobalt wt.% (default: 0.0)
  -Cu CU, --Cu CU       Copper wt.% (default: 0.0)
  -Al AL, --Al AL       Aluminium wt.% (default: 0.0)
  -W W, --W W           Tungsten wt.% (default: 0.0)

required arguments:
  -Tini TINI, --Tini TINI
                        Initial temperature (oC) (default: None)
  -t T, --t T           Total time (s) (default: None)
  -phi PHI, --phi PHI   Cooling rate (oC/s; if 0, isothermal) (default: 0.0)
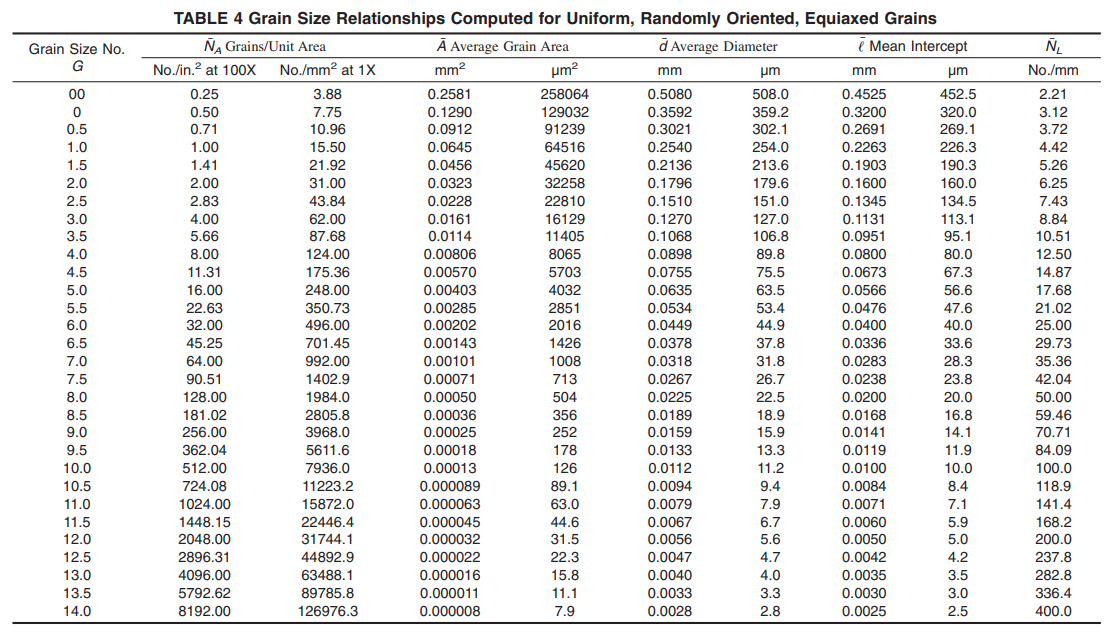
Please notice that the grain size specified as the ASTM grain size number, defined by the ASTM E112 standard. The default value used in the scripts is 7, which corresponds to an average diameter of about 30 μm. Use the table below as a reference:
A script with examples is available in the repository: examples.py.
Plot TTT and CCT diagrams:
# Run directly from the shell
python3 plot_diagrams.py -C 0.1 -Mn 1 -Tini 900
# Run using jupyter or ipython (e.g., if you're running Spyder)
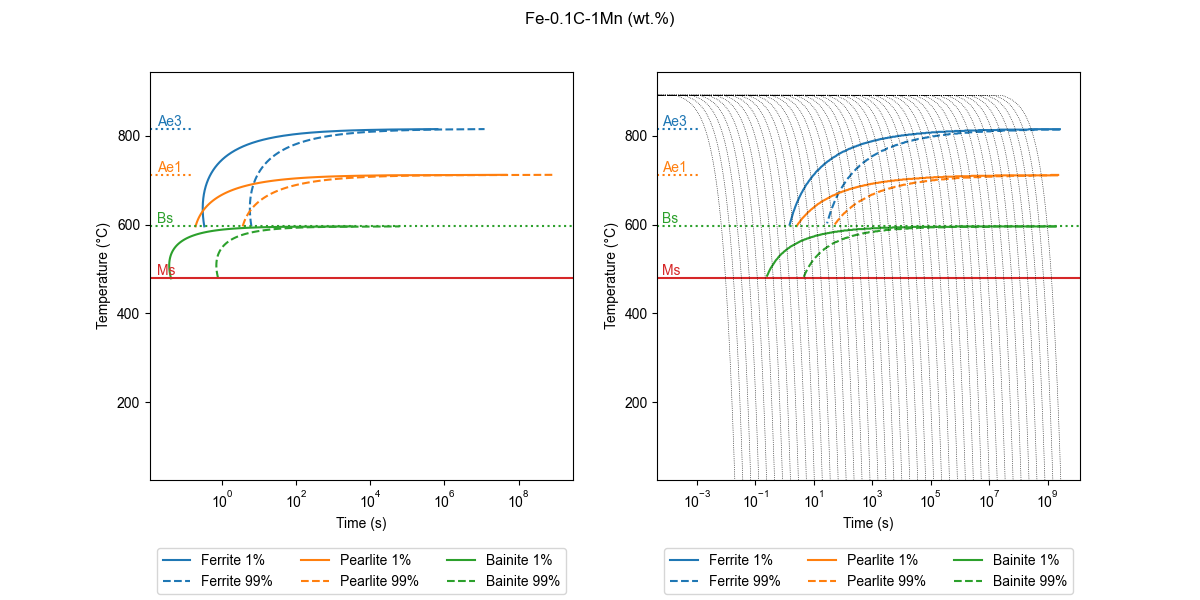
%run plot_diagrams.py -C 0.1 -Mn 1 -Tini 900This will prompt a matplotlib window with the following TTT and CCT diagrams:
Plot phase fraction for a thermal cycle specified by -Tini, -t, and -phi parameters:
# Run directly from the shell
python3 plot_phase_fractions.py -C 0.1 -Mn 1 -Tini 900 -t 45 -phi 20
# Run using jupyter or ipython (e.g., if you're running Spyder)
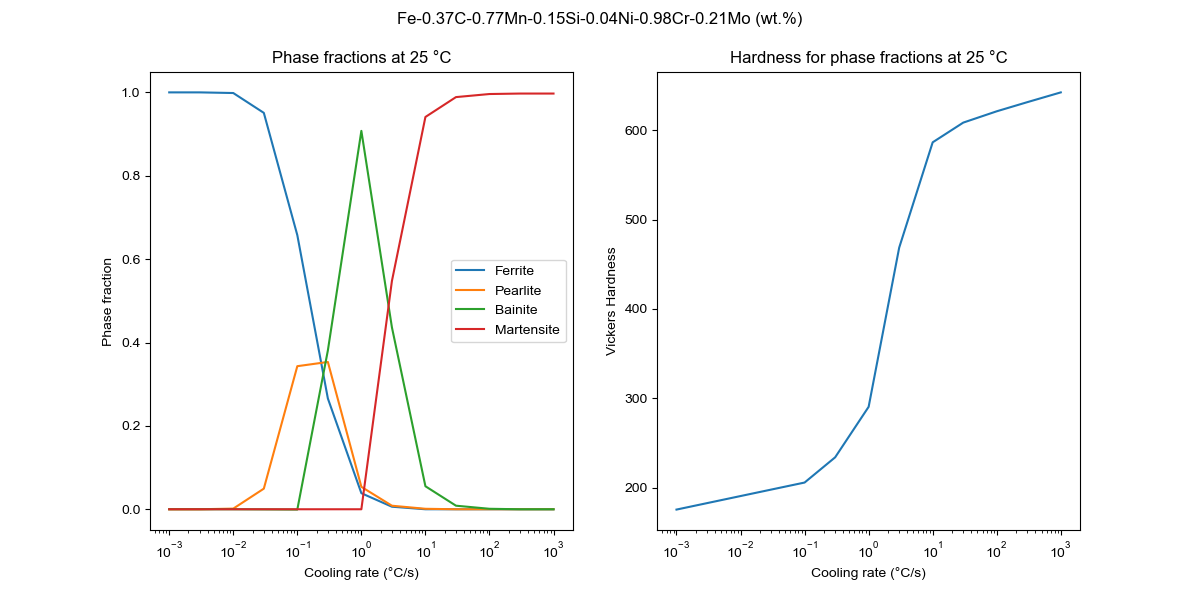
%run plot_phase_fractions.py -C 0.1 -Mn 1 -Tini 900 -t 40 -phi 20Custom scripts can also be written. For example, hardness_vs_cooling_rate.py calculates the phase fractions and hardness values for a list of cooling rates and plots the phase fractions and hardness as a function of the cooling rate.
# Run directly from the shell
python3 hardness_vs_cooling_rate.py
# Run using jupyter or ipython (e.g., if you're running Spyder)
%run hardness_vs_cooling_rate.pyThe hardness is given in Vickers. A hardness conversion tool for other units (e.g., Rockewell, Brinell) can be found here: Hardness conversion tool


