GraphQL Hive provides all the tools to get visibility of your GraphQL architecture at all stages, from standalone APIs to composed schemas (Federation, Stitching):
- Schema Registry with custom breaking changes detection
- Monitoring of RPM, latency, error rate, and more
- Integrations with your favorite tools (Slack, Github Actions, and more)
If you are using Hive as a service, please refer to our documentation: https://docs.graphql-hive.com/features/tokens.
gem install graphql-hive
Add GraphQL::Hive at the end of your schema definition:
class Schema < GraphQL::Schema
  query QueryType

  use(
      GraphQL::Hive,
      {
        token: '<YOUR_TOKEN>',
        reporting: {
          author: ENV['GITHUB_USER'],
          commit: ENV['GITHUB_COMMIT']
        },
      }
  )
end
The reporting configuration is required to push your GraphQL Schema to the Hive registry.
Doing so will help better detect breaking changes and more upcoming features.
If you only want to use the operations monitoring, replace the reporting option with the following report_schema: false.
Calling these hooks are situational - it's likely that you may not need to call them at all!
Call this hook if you are running GraphQL::Hive in a process that forks
itself.
example: puma web server running in ("clustered
mode")
# config/puma.rb
preload_app!

on_worker_boot do
  GraphQL::Hive.instance.on_start
endIf your GraphQL API process is shut down non-gracefully but has a shutdown hook
to call into, call on_worker_exit.
puma example:
# config/puma.rb

on_worker_shutdown do
  GraphQL::Hive.instance.on_exit
end
You are all set! 🚀
When deploying or starting up your GraphQL API, graphql-hive will immediately:
- publish the schema to the Hive registry
- forward the operations metrics to Hive
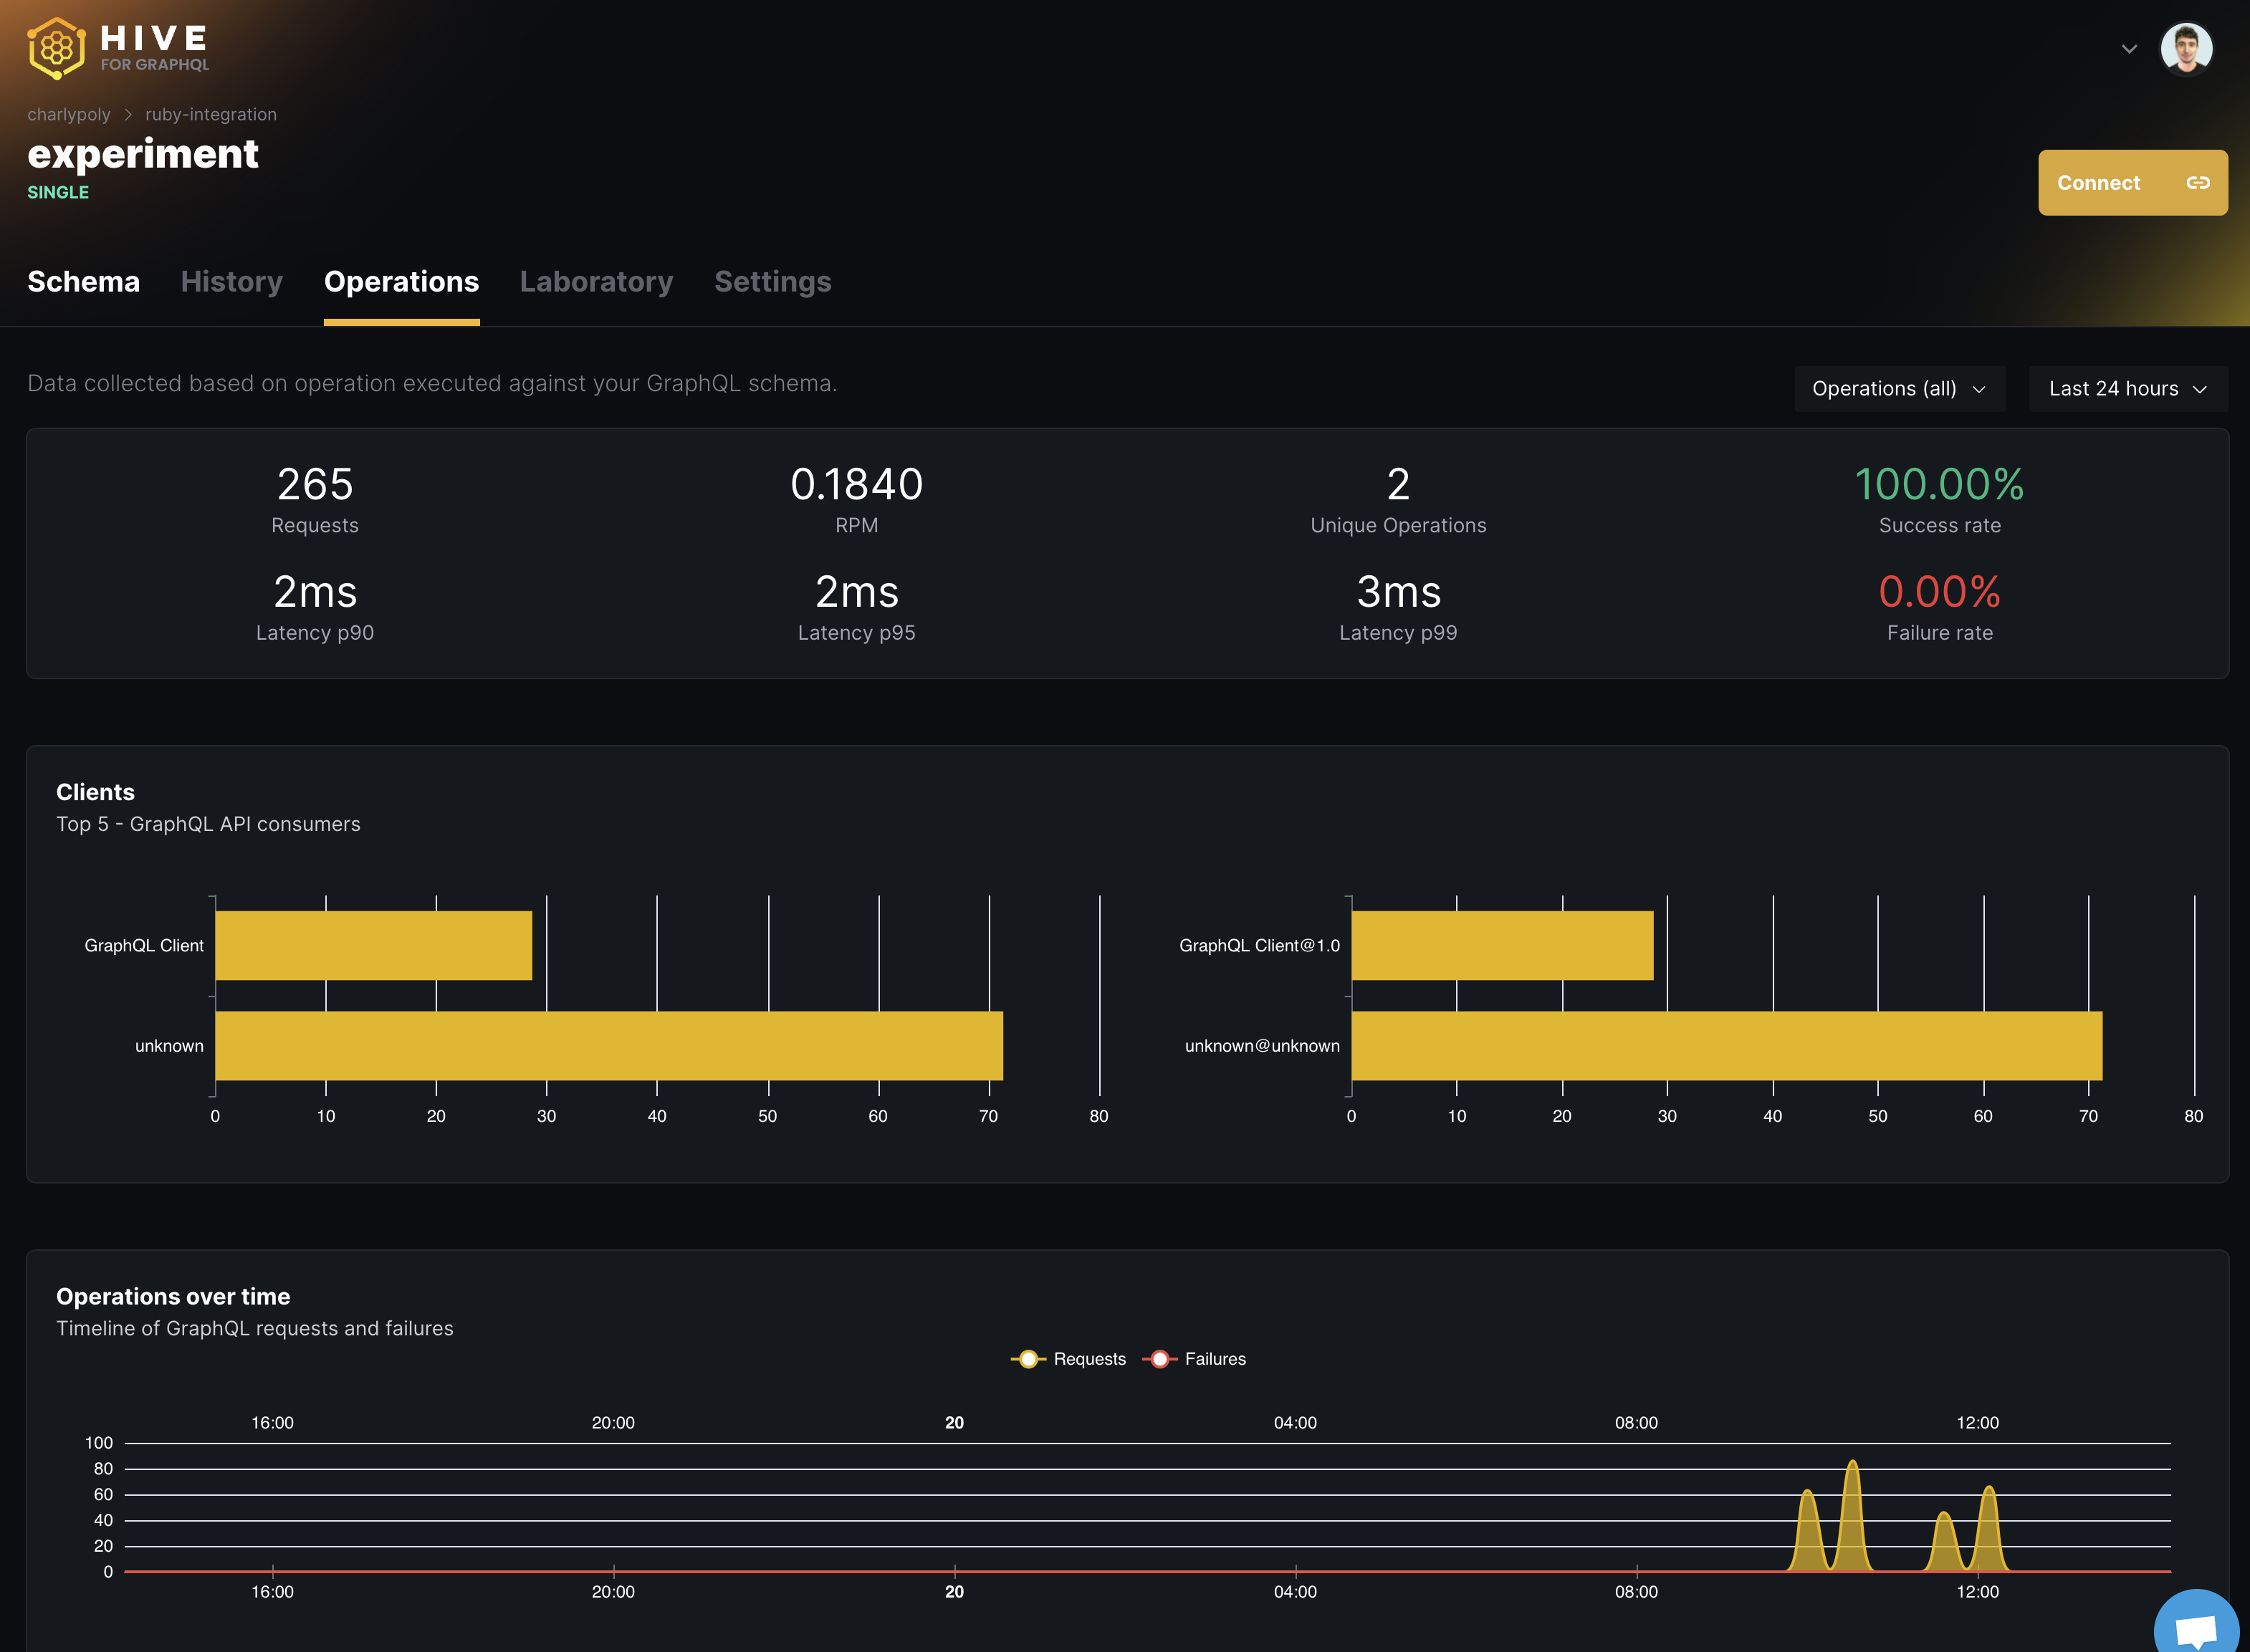
You should now see operations information (RPM, error rate, queries performed) on your GraphQL Hive dashboard:
Stay on top of your GraphQL Schema changes by installing the Hive Github Application and enabling Slack notifications about breaking changes:
https://docs.graphql-hive.com/features/integrations#github
You will find below the complete list of options of GraphQL::Hive:
class MySchema < GraphQL::Schema
  use(
    GraphQL::Hive,
    {
      # mandatory
      token: 'YOUR-TOKEN',

      # optional
      enabled: true, # enable/disable Hive Client
      debug: false, # verbose logs
      logger: MyLogger.new,
      endpoint: 'app.graphql-hive.com',
      port: 80,
      buffer_size: 50, # forward the operations data to Hive every 50 requests

      collect_usage: true, # report usage to Hive
      collect_usage_sampling: {
        # optional members of `collect_usage_sampling`
        sample_rate: 0.5, # % of operations reported
        sampler: proc { |context| context.operation_name.includes?('someQuery') 1 : 0.5 }, # assign custom sampling rates (overrides `sampling rate`)
        at_least_once: true, # sample every distinct operation at least once
        key_generator: proc { |context| context.operation_name } # assign custom keys to distinguish between distinct operations
      }

      report_schema: true,  # publish schema to Hive
      # mandatory if `report_schema: true`
      reporting: {
        # mandatory members of `reporting`
        author: 'Author of the latest change',
        commit: 'git sha or any identifier',
        # optional members of `reporting
        service_name: '',
        service_url: '',
      },

       # pass an optional proc to client_info to help identify the client (ex: Apollo web app) that performed the query
      client_info: proc { |context| { name: context.client_name, version: context.client_version } }
    }
  )

  # ...

end
See default options for the optional parameters here.
A note on buffer_size and performances
The graphql-hive usage reporter, responsible for sending the operations data to Hive, is running in a separate Thread to avoid any significant impact on your GraphQL API performances.
The performance overhead (with the default buffer_size option) is around 1% and is constantly evaluated for new PR.
If your GraphQL API has a high RPM, we encourage you to increase the buffer_size value.
However, please note that a higher buffer_size value will introduce some peak of increase in memory consumption.

