I first began by creating a mask with an "area of interest." Running a bitwise-and on the mask and the source image, I was left with a crop of the original image. I then ran cv.Canny to pre-process the image (don't fully understand the algorithms involved) and ran cv.HoughLinesP to connect lines between the intensity points (cones) with a maximum line length of 300px such that the cones in one line would connect but wouldn't connect to cones in the other lane due to being farther than 300px. The issue was that multiple lines would span from each cone connecting to the other cones in its line; I now realize however that perhaps I could've taken the largest line of each side, but it still doesn't account that if the floor design had been more complex, there would be multiple intensity points and the cv.HoughLinesP algorithm would be confused.
My second approach was to use cv.inRange to mask the image by color. At first I thought I could capture the reds but just using the color range (0,0,0) → (0,0,255); however, the output was a black screen. I then ran a for loop on all possible ranges with intervals of 10 and logged them to a file. I then found the ranges that best worked for capturing and isolating the cones. I then ran cv.findContours which clearly highlighted the cones in green, when checked. I then split the image in half and determined the min and max contour points of each half respectively; however, when I plotted lines between the points of the image, the lines were very skewed from the cones. I suspected that the color filter had picked up the exit signs and the contour detection had picked up small points that were too small to be displayed when I had checked contour shapes.
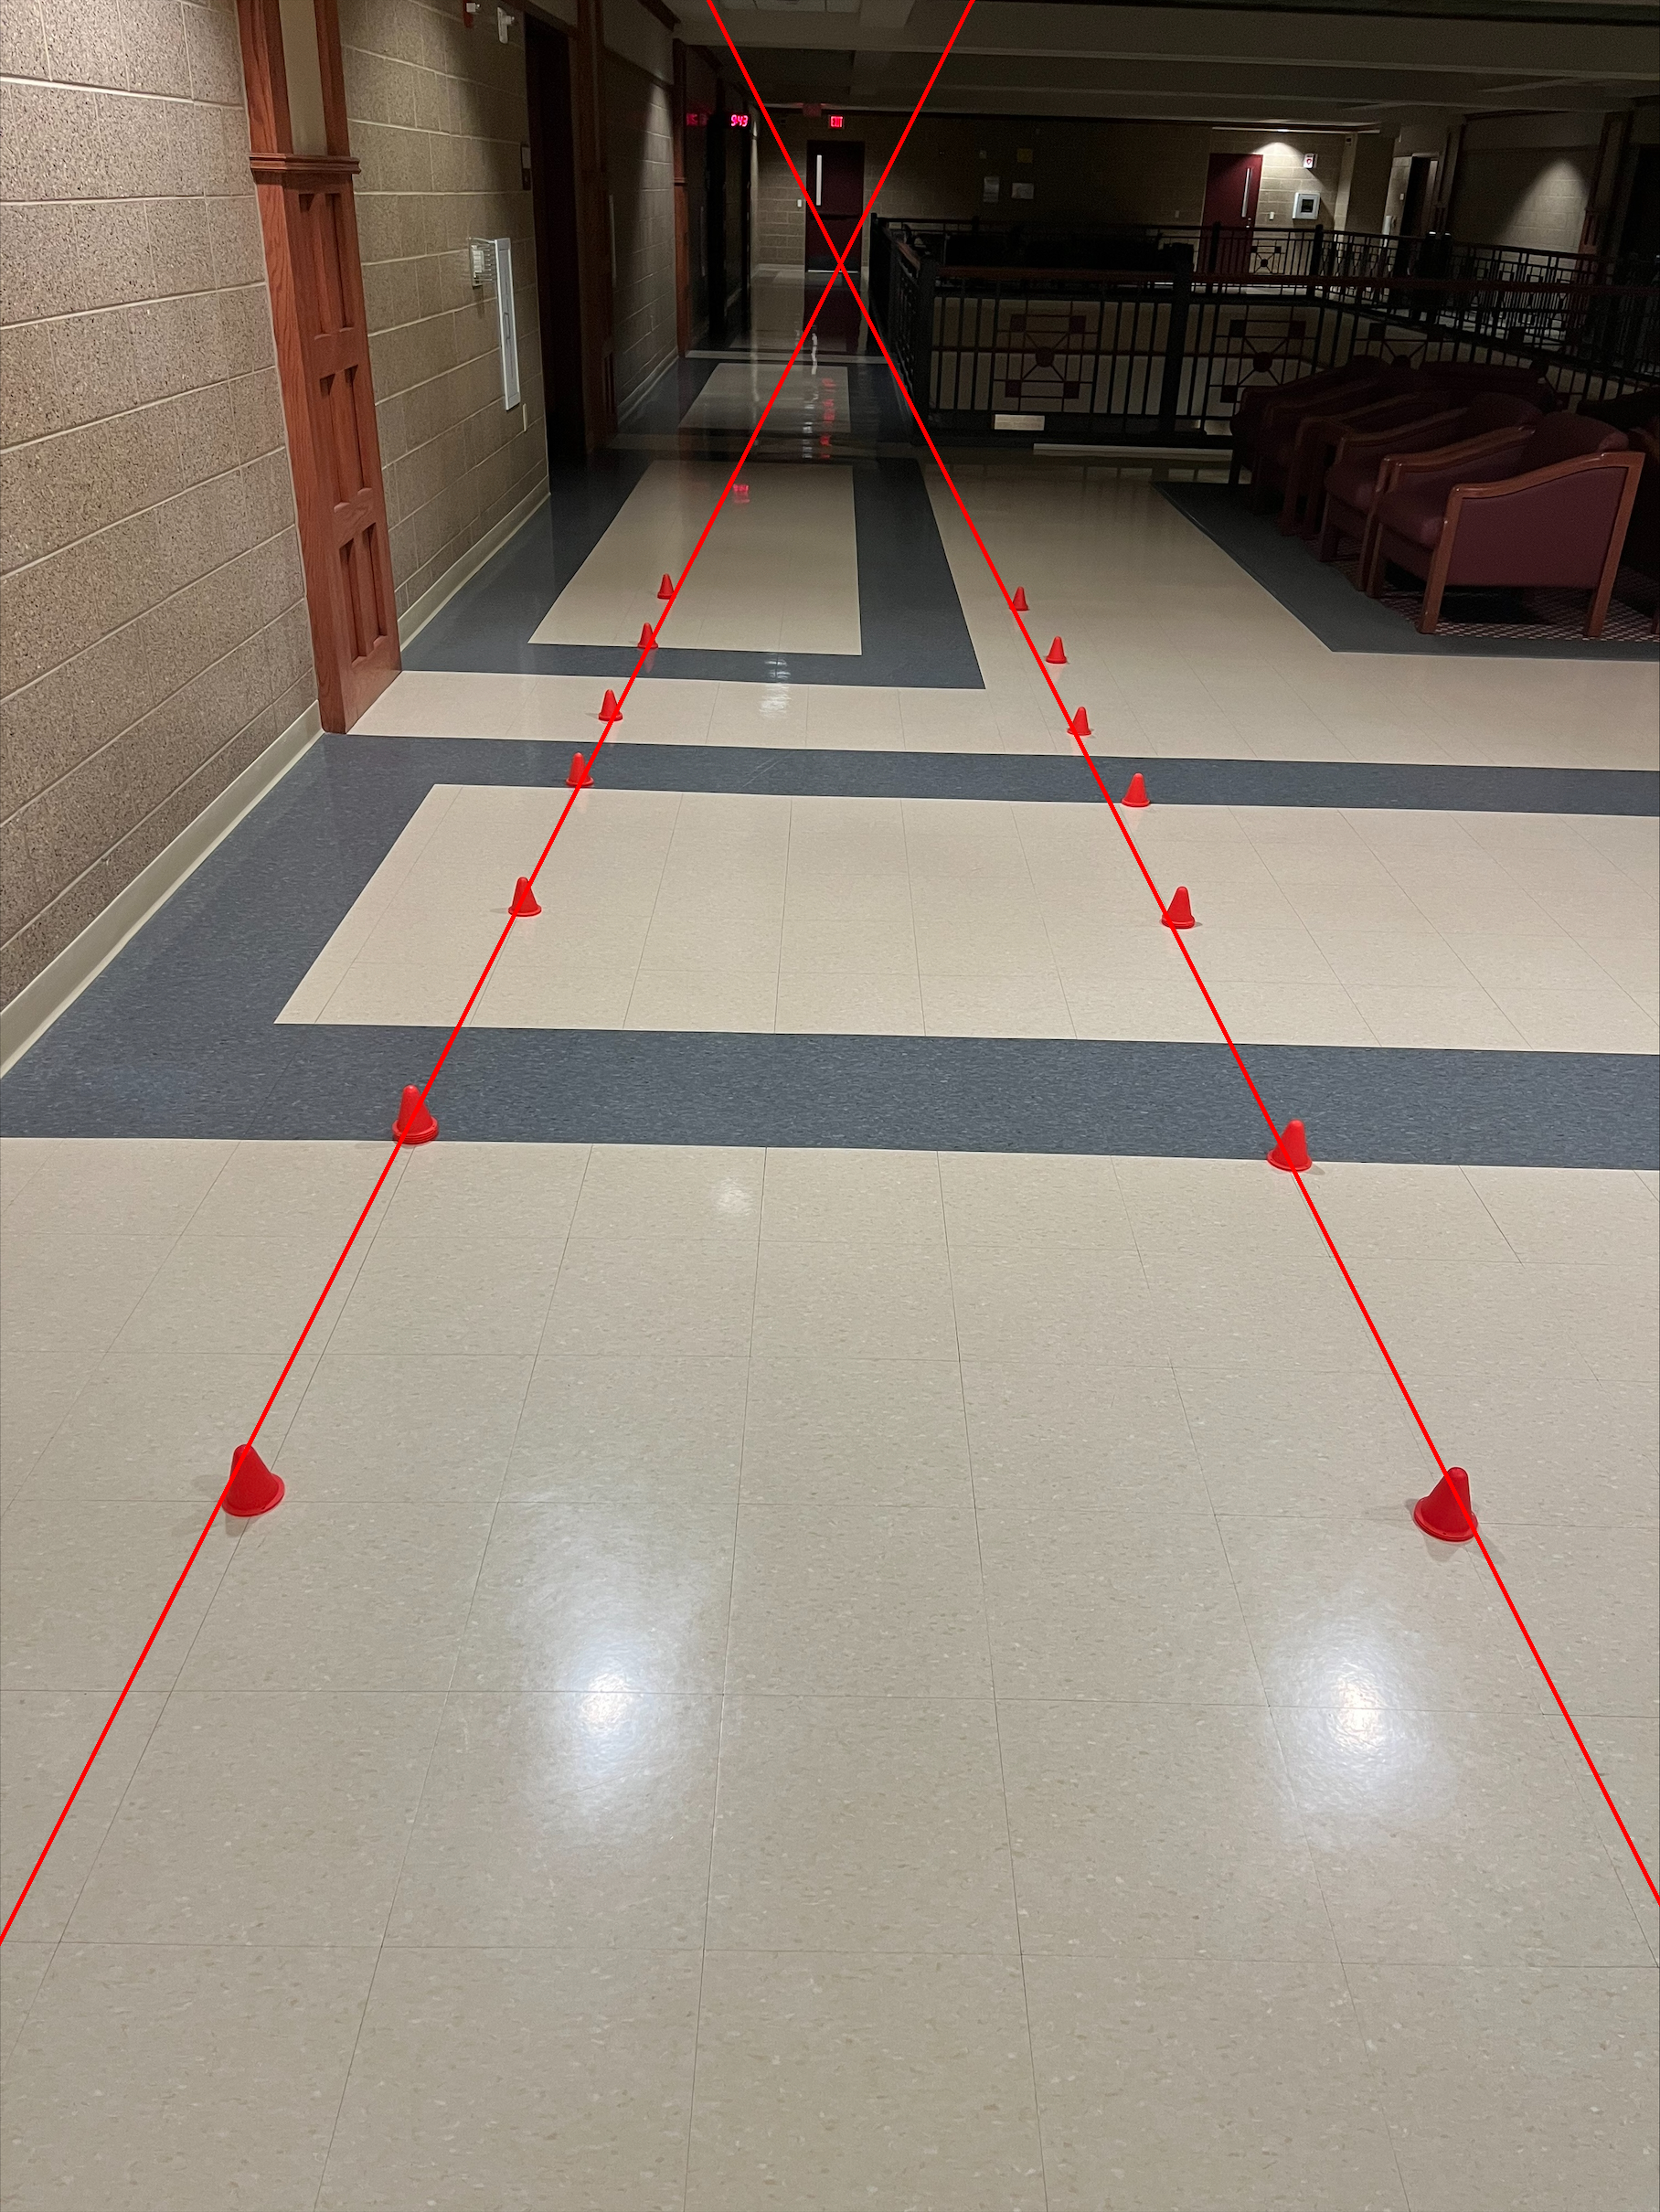
My final approach followed a majority of Approach II but involved an area mask in addition to the color mask. Essentially we were zero-ing pixels in the image that were not within our red range and not within our "area of interest." I then finally calculated the slope of the two points on each side in order to extend the line to the dimensions of the photo.
The algorithm I wrote to find the min/max points on both sides uses for loops rather than NumPY's functions which would decrease readability but increase efficiency. That would be one aspect I would improve; however, these masks in general are likely far more efficient than a solution using Machine Learning.
Another possible area to focus on is that the algorithm current draws a line through the outer edges of the bottom cones and the inner edges of the top cones due to using min and max points. A way to get a more even line that goes through the cones would to maybe take a regression of the contour points on each side and generate a line that way; however, this could decrease efficiency.
- OpenCV: Primary library used for loading/saving images, changing color channels, blurring, color filtering, area masking, and contour detection; essentially, all image analysis was done with OpenCV.
- NumPY: Used for making deep copies of the source image and retrieving properties about the image like it's height, width, and number of color channels.
- MatPlotLib: Used for displaying images within the Jupyter notebook rather than OpenCV's display which opens a new window.
