All that’s needed is Ruby 2.5 or better (or JRuby 9.2 or better) and a few Ruby gems (including at least Asciidoctor 2.0.0), which we explain how to install in the next section.
To check if you have Ruby available, use the ruby command to query the version installed:
$ ruby -e 'puts RUBY_VERSION'
Make sure this command reports a Ruby version that’s at least 2.5. If so, you may proceed.
You can get Asciidoctor Chart by installing the published gem. You can also run the code from source if you want to use a development version or participate in development.
To install Asciidoctor Chart, first make sure you have satisfied the prerequisites. Then, install the gem from RubyGems.org using the following command:
$ gem install asciidoctor-chart
Assuming all the required gems install properly, you can enable the extension using --require option (or -r for short) from the Asciidoctor CLI:
$ asciidoctor --require asciidoctor-chart my-doc.adoc
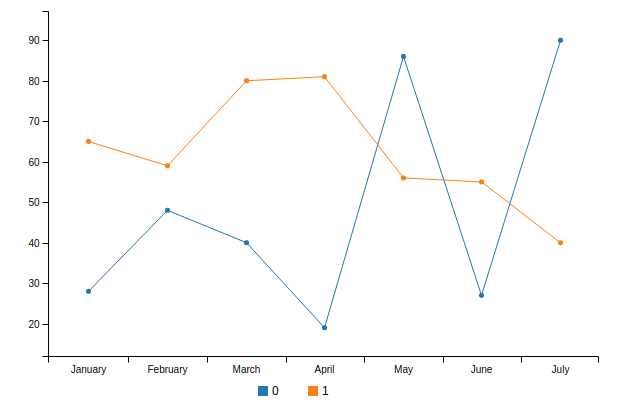
- Line chart powered by C3.js (default) declared as a literal block
-
[chart,line]
....
January,February,March,April,May,June,July
28,48,40,19,86,27,90
65,59,80,81,56,55,40
....
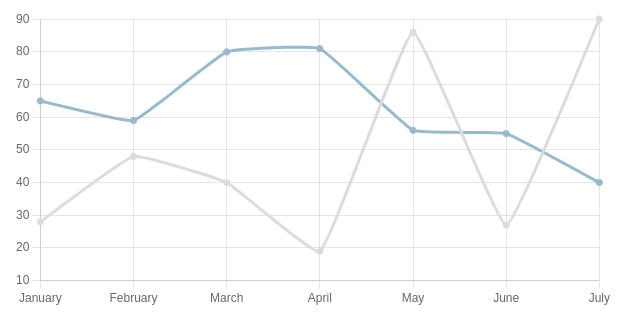
- Line chart powered by Chart.js declared as a block macro with a CSV file as target
-
chart::sample-data.csv[line,engine="chartjs"]
For more examples, see example.adoc.
| Attribute Name | Value(s) | Description |
|---|---|---|
c3jsdir |
<file|URL> |
Overrides c3.js directory, where the following files |
chartjsdir |
<file|URL> |
Overrides chart.js directory, where the following file |
chartistdir |
<file|URL> |
Overrides chartist.js directory, where the following files |
d3jsdir |
<file|URL> |
Overrides d3.js directory, where the following file |
Asciidoctor Chart was written by Guillaume Grossetie.
Copyright © 2014-present Guillaume Grossetie Free use of this software is granted under the terms of the MIT License.
For the full text of the license, see the LICENSE file.


