Using the d3 requires to install the library:
Html will run the whole css, d3 and more.
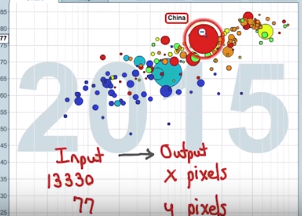
Goal is to replicate the famous Gapminder scatter plot to D3:
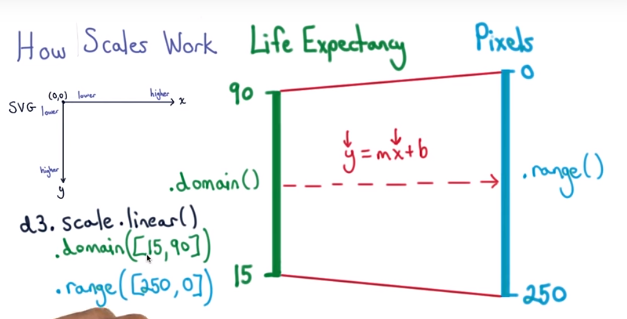
How scales work
Step 0: find a beautiful CSS And HTML page, remove the unncessaries with:
d3.select('.main').html("");
Step 1: Add SVG brah!
var svg = d3.select('.main').append('svg');
svg.attr('width',600).attr('height',300);
Step 2 Mapping the scalse:
Adjust the height
#life expense (15-90 ) To 250-0
var y = d3.scale.linear().domain([15,90]).range([250,0]);
y(15):0
#Quiz: GDP per capita : 250- 100,000
var x = ?
Answer :
var x = d3.scale**.log().**domain([250,100000]).range([0,600]);
x(100000):600
Step 3: Drawing the circles (r)
var r = d3.scale.sqrt().domain([52070,1390000]).range([10,40]);
r(1300000):48
Now lets check if all the points are working:
console.log(y(77),x(13338),r(1380000))
43.333333333333314 398.25769816993596 49.821260992838134
svg.append('circle').attr('fill','red').attr('r',r(1380000)).attr('cx',x(13330)).attr('cy',y(77));
Japan:
-
Paste contents of d3.min.js file into console.
-
File can be found here.
-
Expected Output: True
-
Clear content from div in course viewer: Input: d3.select('.main').html('');
-
Expected Output: >[Array[1]]
-
Define svg variable: Input: var svg = d3.select('.main').append('svg')
-
Expected Output: undefined
-
Assign y axis linear scale to y variable. This axis describes life expectancy. Note that while the height of the svg is 300 pixels, only 250 are used for the y axis to leave a buffer. Also, for the y axis the max value comes first because of a quirk with how objects are drawn in the browser: highest value at bottom of axis. Input: var y = d3.scale.linear().domain([15,90]).range([250,0]);
-
Expected Output: undefined
-
Assign X axis scale to x variable. This axis describes annual income. Input: var x = d3.scale.log().domain([250,100000]).range([0,600]);
-
Expected Output: undefined
-
Assign radius scale to r variable. The radius corresponds to the square root of the population. Input: var r = d3.scale.sqrt().domain([52070, 1380000000]).range([10, 50]);
-
Check scaling with console.log by plugging in life expectancy for China in y variable, and annual income per person for China in x variable, and population for China in r variable. Input: console.log(y(77), x(13330), r(1380000000));
-
Expected Output appox: 43.33333333333314 398.1976156961321 50
-
Append circle with attribute values for radius, fill color, center x and center y of circle: Input: svg.append('circle').attr('r', r(1380000000)).attr('fill','red').attr('cx', x(13330)).attr('cy', y(77));
-
Expected Output: >[Array[1]]
-
Look at placement of the circle in the svg, and compare with the placement in the original Gapminder World graph: http://www.gapminder.org/world/
library(ggplot2)
df <- read.csv("data/cereal.csv")
For replacing negative values I’ve used the following:
df[df<0] <- 1
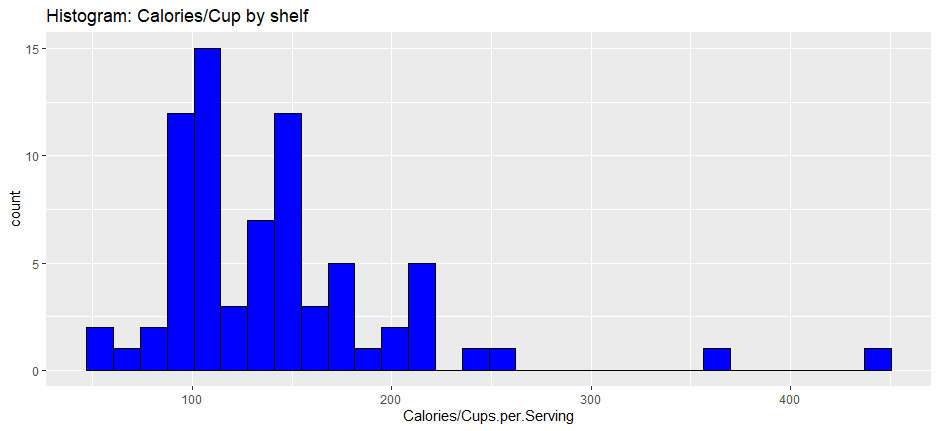
**Histogram of calories_per_cup (computed element) **
Code:
ggplot(data=df,aes(x=Calories/Cups.per.Serving))+ggtitle("Histogram: Calories/Cup by shelf")+geom_histogram(colour='black',fill="blue")
Last
Histogram of calories_per_cup faceted by Shelf
Code: h+facet_wrap(~Display.Shelf,nrow=1)+ggtitle('Histogram Facet by shelf') + scale_fill_gradient(low="blue")
HistogramFacedbyShelf
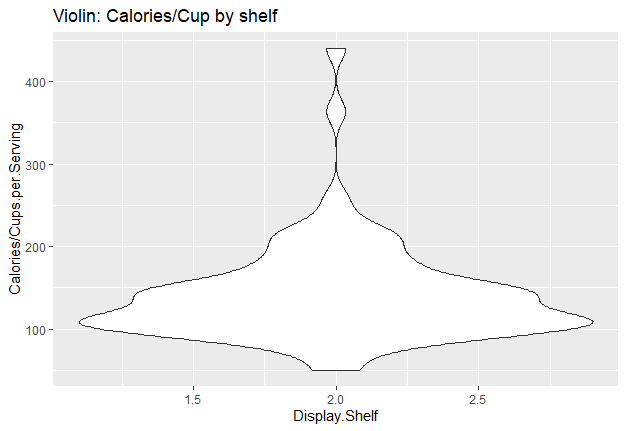
Violin
v <-ggplot(data=df,aes(x=Display.Shelf,y=Calories/Cups.per.Serving))+ggtitle("Calories/Cup by shelf")+geom_violin()
v+facet_wrap(~Display.Shelf,nrow=1)+ggtitle('Violin Facet by shelf')
C:\Users\as630696\AppData\Local\Microsoft\Windows\INetCache\Content.Word\Violing by shelf.png
