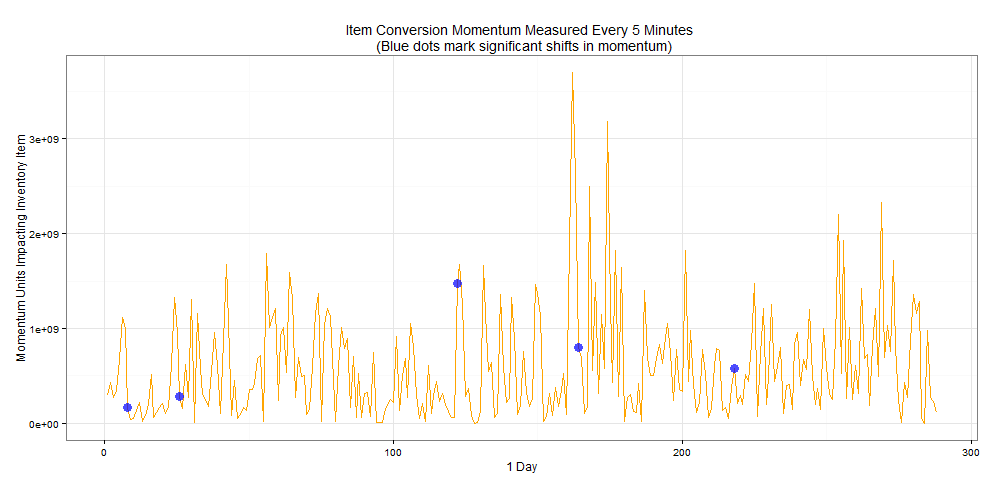
Product Popularity Index Project
-
Data csv is in Data/ folder
-
Predicted Momentum has some errors (gotta tweak my distributions)
-
Assumptions around the distributions:
INVENTORY AVAILABILITY: "inv.avail"
A Gaussian distribution is assumed, to begin with the passed in inventory average. It uses 40% of the average as the variation from mean inventory. This approximates the "Stock Control Model". We're not going to model the stock buffer here. Instead, we'll take all 0 and - data points to approximate the lower gaussian ranges.
ATB VELOCITY TOTAL ITEMS IN MCOM BAGS (POTENTIAL CONVERSIONS, ATB VELOCITY)/time interval
We're going to use a Bimodal Gaussian distribution to simulate the velocity of items being added to bag in a day. The first period is a gaussian dist. that suggests early day passive buying with a peak, whereas the second period suggests increased buying activity and thus item velocity. Since this distribution simulates velocity over a day, we first break down the data set by intended time interval.
SELL VELOCITY Same.
