A simple statistical profiler which outputs in format suitable for FlameGraph.
Based on https://github.com/evanhempel/python-flamegraph but modified to use signal.setitimer instead of a separate thread, in order to more accurately profile code that uses C extensions heavily.
Simply run:
pip install git+https://github.com/asokoloski/python-flamegraph.git
Run your script under the profiler:
python -m flamegraph -o perf.log myscript.py --your-script args here
Or, run the profiler from your script:
flamegraph.start_profiler(fd=open("./perf.log", "w"))
Run Brendan Gregg's FlameGraph tool against the output:
flamegraph.pl --title "MyScript CPU" perf.log > perf.svg
Enjoy the output:
Filtering
Sometimes you may want to exclude a method (for example in a server the method that waits for a new request) or you may want to profile only a subset of your code (a particular method and its children which are performance critical).
Filtering can be done by passing a python regular expression to the
-f or --filter command line option
which will restrict output to only those lines which match.
Filtering is done against the entire line so you can filter by
function name or by more complex filters such as function
ABC calls DEF (ABC.*DEF).
Alternatively since the output is stackframes each on a line by itself, this can simply be done with a simple grep filter.:
Exclude:

  grep -v waiting_method perf.log > removed_waiting.log

Include:

  grep function_name perf.log > filtered.log
Then run the flamegraph.pl script against the filtered file.

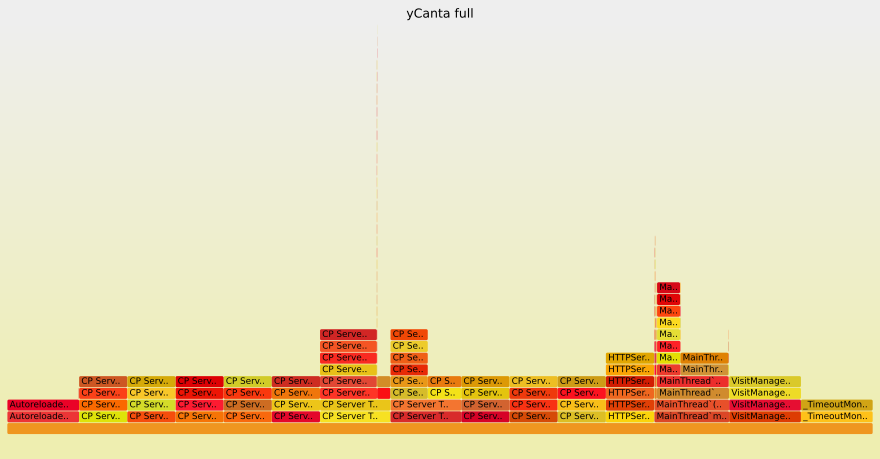
Full profile output of yCanta webapp PDF export. Most time is spent in wait state and graph is not very helpful.

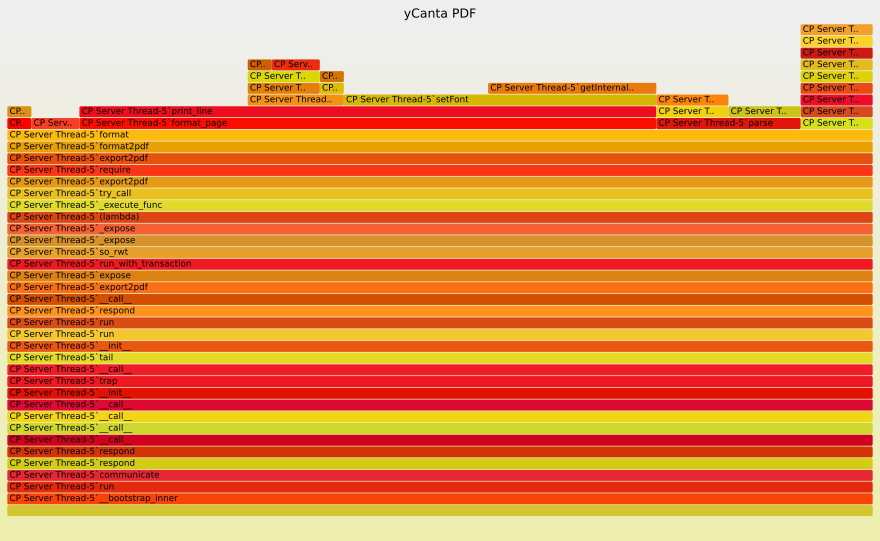
Filtered profile output of yCanta webapp PDF export. Filtering was on the pdf format function so time spent in wait state has been excluded and the graph is now helpful.
