Automatically exported from code.google.com/p/gpxplot
This script can plot profiles of GPX tracks or prepare plot data for external tools. Two types of profiles are currently supported: velocity and elevation (altitude) as a function of time or distance travelled. Multi-segment (non-continuous) GPS tracks are supported.
Normally, gpxplot reads GPX track and evaluates distance and velocity data.
It can print data in tabular form suitable for plotting by external plotting tools.
It can also plot trip profile directly using gnuplot (see options -g and -o).
Features:
- using haversine formula to calculate distances (spherical Earth)
- support of multi-segment (discontinuous) tracks
- gnuplot support:
- generate plots if gnuplot.py is available
- generate gnuplot script if gnuplot.py is not available
- plot interactively and plot-to-file modes
Google Chart API supportDEPRECATEDprint URL or the plotDEPRECATED
- tabular track profile data can be generated
- metric and English units
- timezone support
You can also use gpxplot online, please check gpxplot page.
There is also a simple API for the web script.
The online version may stop working without notice, because image-based Google Charts are deprecated
Current version: gpxplot.py
Usage: gpxplot.py [action] [options] track.gpx

Actions:
-g            plot using gnuplot.py
--gprint      print gnuplot script to standard output
--google      print Google Chart URL
--table       print data table (default)

Options:
-h, --help    print this message
-E            use English units (metric units used by default)
-x var        plot var = { time | distance } against x-axis
-y var        plot var = { elevation | velocity } against y-axis
-o imagefile  save plot to image file (supported: PNG, JPG, EPS, SVG)
-t tzname     use local timezone tzname (e.g. 'Europe/Moscow')
-n N_points   reduce number of points in the plot to approximately N_points
Please visit gpxplot.appspot.com to plot your GPX tracks online. It should be straightforward, but online version is less powerful than the stand-alone script. This feauture is deprecated
If you want to plot profiles for your tracks automatically, but don't want to install the script, you can use web API. Just put your GPX tracks online, and reference them in the request:
http://gpxplot.appspot.com/api/0.1.2/plot?gpxurl=URL_OF_YOUR_GPX_FILE&output=png
You can use this request URL as a URL of the image, for example:
<img src="http://gpxplot.appspot.com/api/0.1.2/plot?gpxurl=URL_OF_YOUR_GPX_FILE&
output=png" alt="Elevation profile" width="600" height="400">
Availability of this service is subject to free quotas on Google App Engine. Also, Google App Engine is not very good at processing big files (1 MB and more). Incompatible changes to the API correspond will be reflected in the second version number (0.1.2 ⇒ 0.2.0).
Web API versions: 0.1, 0.1.1, 0.1.2.
If you run gpxplot like this:
$ ./gpxplot.py -g -x time -y elevation test.gpx
it will try to plot elevation-against-time profile for given track. You need gnuplot.py installed run this example. A new window with a plot will open.
If you have only gnuplot installed, but not gnuplot.py, you can print the gnuplot script to standard output.
In this case run gnuplot manually like this:
$ ./gpxplot.py --gprint -x time -y elevation test.gpx | gnuplot -persist -
To save the plot to file use -o filename:
./gpxplot.py -g -x time -y elevation -o track.svg test.gpx
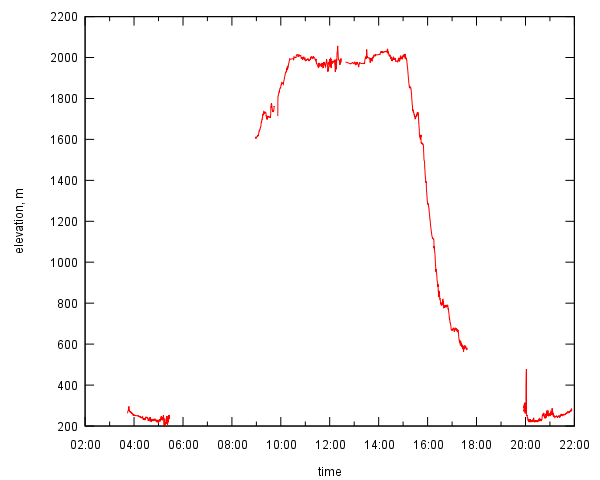
The plot generated may look like this:
To plot using Google Chart API use --google:
./gpxplot.py --google -n 200 -E test.gpx
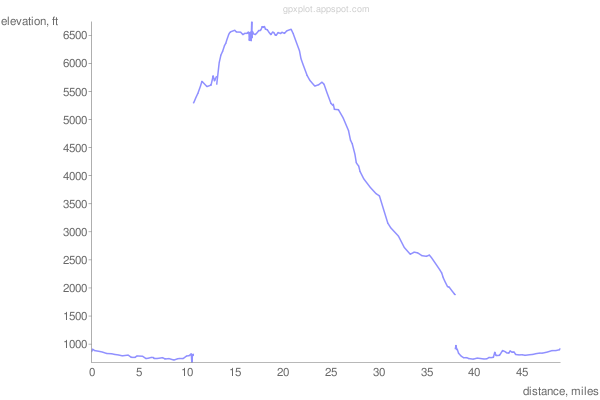
It will print a long URL, which points to the PNG image with a plot:
A small tip: unix shell considers “&” symbols in the URL as an “end of command” markers. To avoid it, quote the URL properly in shell scripts. For example, to view the plot in the browser, the shell command is
firefox "$(gpxplot.py -google -n 200 -E test.gpx)"
Please note that the number of points was reduced to approximately 200 (option -n 200)
and the units are miles/feet (option -E).
-
Please note that time or elevation data may be missing from the GPX file. Such tracks may be produced, for example, by Garmin devices, if you use their Save track function (use their ACTIVE LOG instead). Track files without time data cannot be used to plot velocity or time profiles.
-
Preprocessing tracks with gpsbabel is a good idea. For example, this would remove many ``wrong'' points from the track:
gpsbabel -t -i gpx -f original-track.gpx -x discard,hdop=3,vdop=3 -o gpx -F fixed-track.gpx -
Saving images to vector graphics formats (SVG, EPS) may produce higher quality plots.
-
You can smooth and average your track with gpsbabel before plotting with gpxplot. Two gpsbabel filters are especially useful:
-x simplify,count=N(to reduce number of points) and-x position,distance=Nm(to increase minimal distance between track points to N meters). -
gpxplot may be used in unix pipes, a special filename "-" means that the data (GPX file) is to be read from stdin. For instance:
cat my-track.gpx | \
gpsbabel -i gpx -f - -x position,distance=100m -o gpx -F - | \
gpxplot.py --gprint -x dist -y vel - | \
gnuplot -persist -

