Pillbox from the National Library of Medicine is a pill identifier portal that is representative of what is currently available in terms of identifying pills (https://pillbox.nlm.nih.gov/) It shows the use of the drop down menu. There is no option for using pictures to help pre-populate the fields.
Patients particularly those over 50 are more likely to be prescribed more prescriptions, are more likely to store their medication in pill boxes, are more likely to have dexterity issues and may also have issues with eyesight. This project is looking at a way to improve efficiency and accuracy by using images to help pre-populate input fields.
- src : Source code
- tests : Test model on specific image
- data : Example data
- Android : Code for Android deployment
- Flask : Code for Flask deployment
- static : README content and images
Requirements for this project can be installed by creating the required environment using the pillid.yml file in the build folder
conda env create -f pillid.yml
- Fastai
- Flask
- Android Studio
- train.py - train the data using the following parameters:
- Learning rate of 0.01 (please view lr.py under Test as to why this learning rate was chosen)
- Random Dihedral data augmentation (please view under analysis below)
- Random Balance=0.2 and Contrast=0.8 data augmentation (please view under analysis below)
- dropout = 0.25
python train.py
- cm.py - use to construct a confusion matrix
- lr.py - use to get the best learning rate for the data
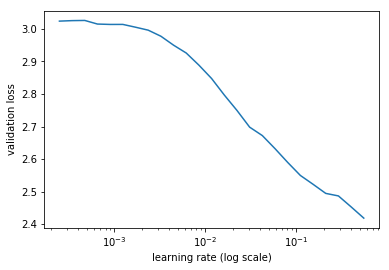
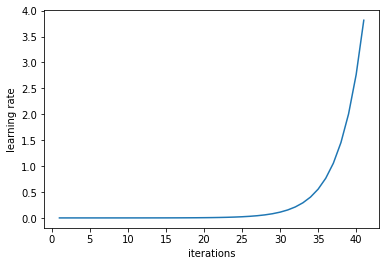
When we compare the validation loss against the log learning rate (for an inital test set) we can see that the best learning rate is just prior to the curve leveling off at the bottom, in this case 0.01
- test.py - use this to test a pretrained model and set thresholds
python cm.py
- infer.py - classification on a single image
python infer.py
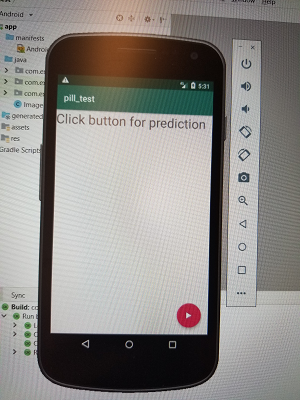
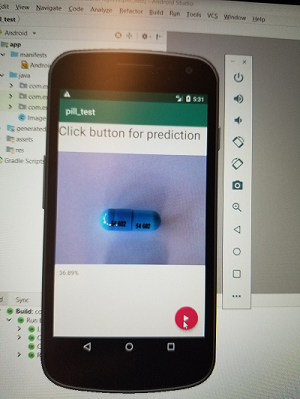
- Two serving endpoints: Android
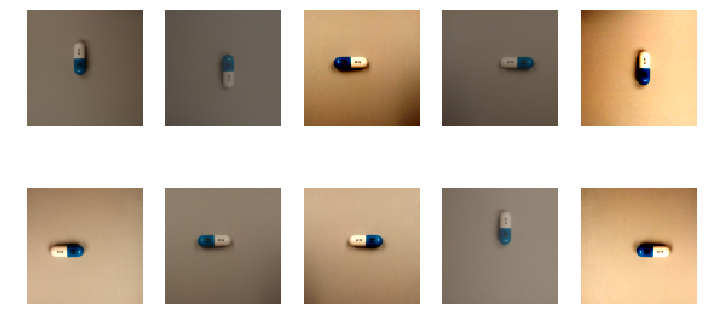
- Data augmentation using Random Dihyedral (this rotates the image by 90 degrees and/or flips images and adjusting balance and contract (this was to mimic images taken with a cell phone)
- Confusion matrix with respect to color representing 13 predicted labels on the x-axis and 13 true labels on the y-axis
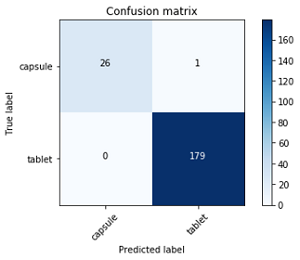
- Confusion matrix with respect to shape
- Results showing most accurate and least accurate with respect to color. The images that had the strongest color predictions are representative of images from the NLM database which are predominantly high resolution and sourced from the manufacturer. These however are not representative of pictures that would be taken by an end user.

