/DiagrammerGPT

Official code repository for: DiagrammerGPT: Generating Open-Domain, Open-Platform Diagrams via LLM Planning (COLM 2024)

Primary LanguagePythonMIT LicenseMIT

Official implementation of DiagrammerGPT, a novel two-stage text-to-diagram generation framework that leverages the layout guidance capabilities of LLMs to generate more accurate open-domain, open-platform diagrams.

arXiv ProjectPage

Abhay Zala, Han Lin, Jaemin Cho, Mohit Bansal

Code Release Todo List

  • Diagram Plan Generation Source Code
  • Diagram Generation Source Code
  • AI2D-Caption Dataset Release


An overview of DiagrammerGPT, our two-stage framework for open-domain, open platform diagram generation.

  • In the first diagram planning stage, given a prompt, our LLM (GPT-4) generates a diagram plan, which consists of dense entities (objects and text labels), fine-grained relationships (between the entities), and precise layouts (2D bounding boxes of entities). Then, the LLM iteratively refines the diagram plan (i.e., updating the plan to better align with the input prompts).
  • In the second diagram generation stage, our DiagramGLIGEN outputs the diagram given the diagram plan, then, we render the text labels on the diagram.

Generated Examples

Input Prompt Diagram Plan Generated Diagram
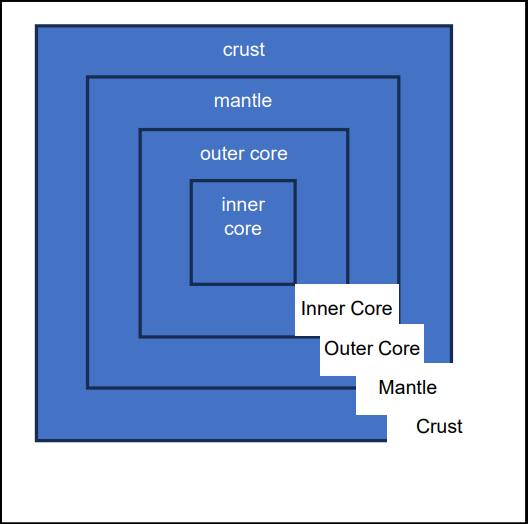
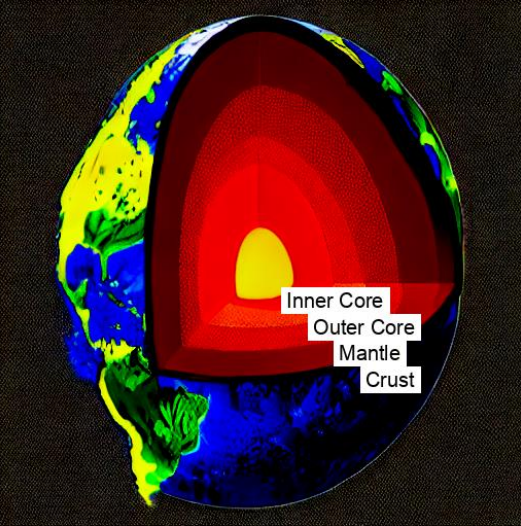
A diagram showing the layers of the earth. It includes the inner and outer cores, the mantle, and the crust.
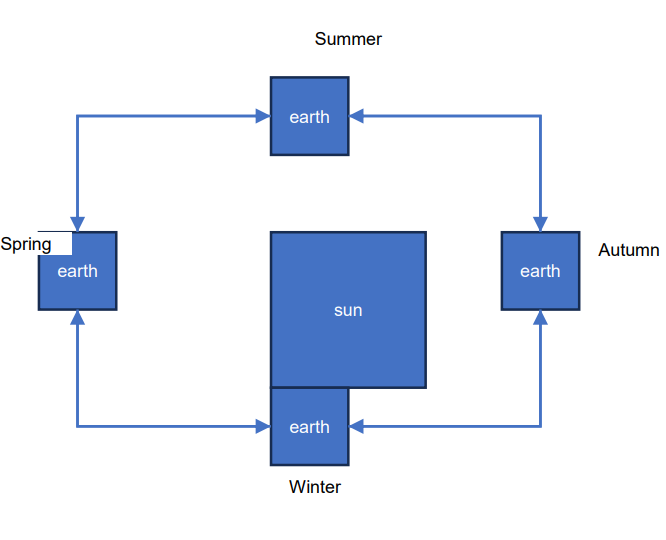
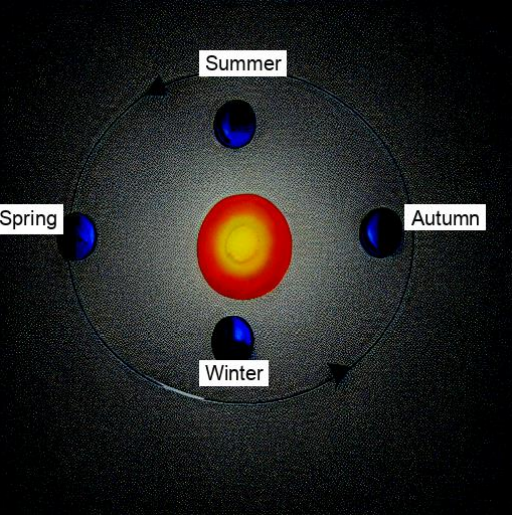
A diagram showing the Earth's position in four phases as it revolves around the sun.
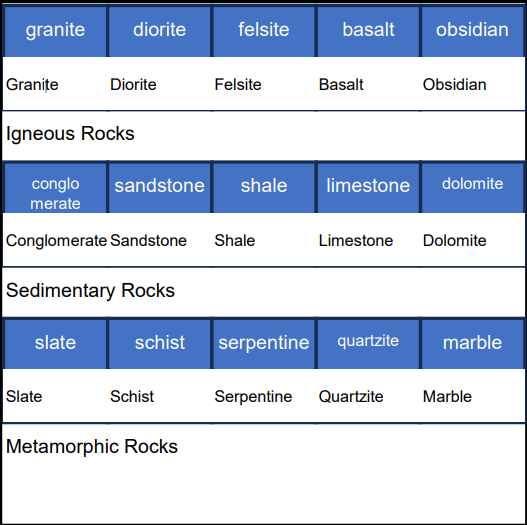
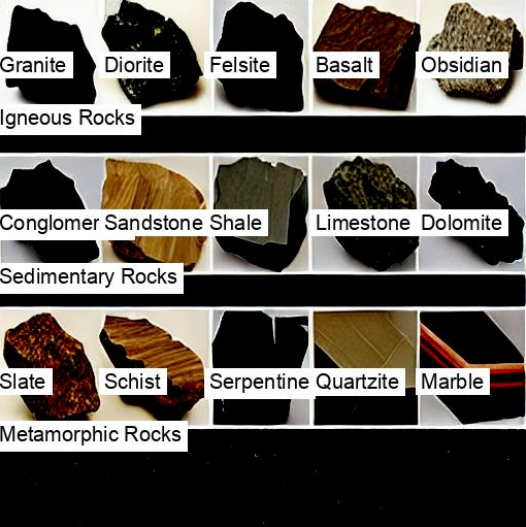
A diagram showing three rows of rocks. Each row has 5 rocks. The first row shows different types of igneous rocks, including granite, diorite, felsite, basalt, and obsidian. The second row shows different types of sedimentary rocks, including conglomerate, sandstone, shale, limestone, and dolomite. The third row shows different types of metamorphic rocks, including slate, schist, serpentine, quartzite, and marble. Include a label for the type of rock each row shows and each rock.

Examples Rendered with Other Platforms

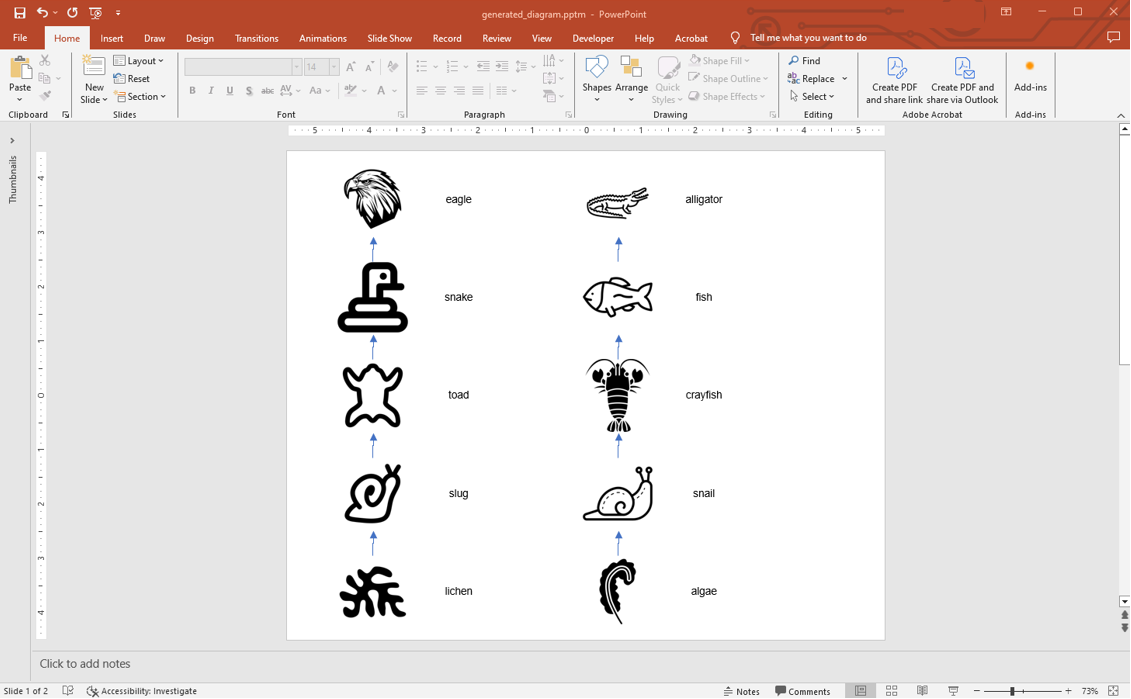
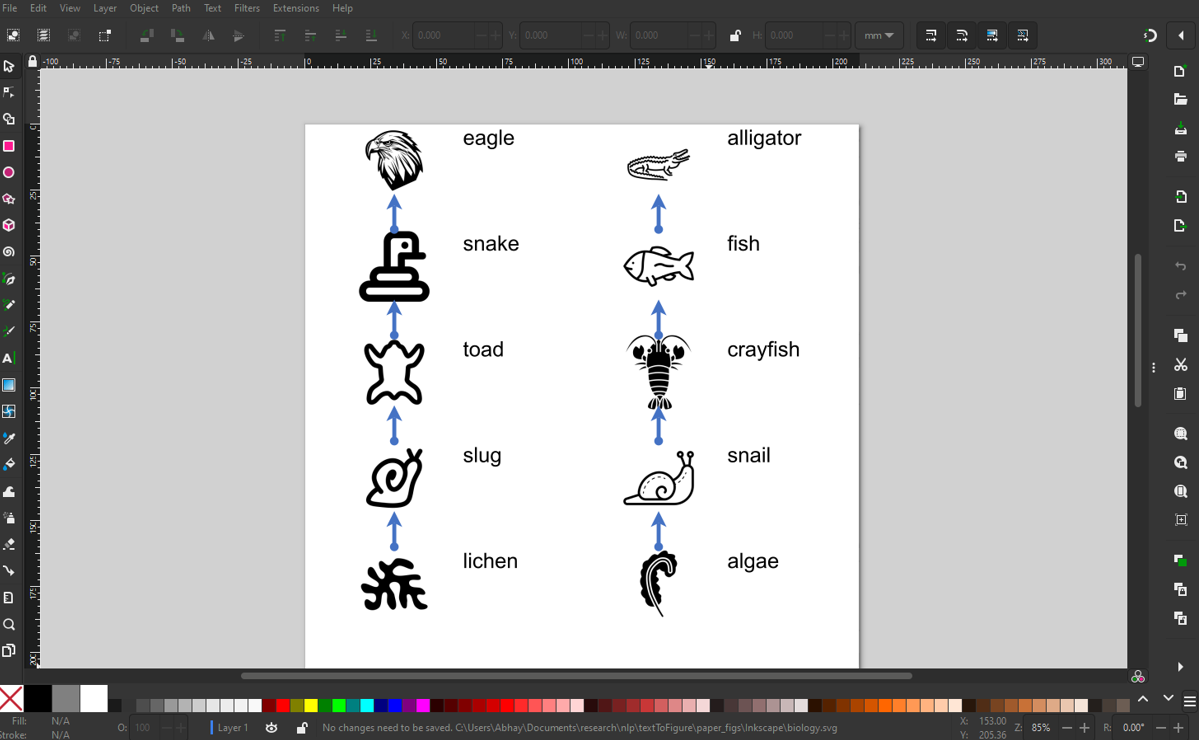
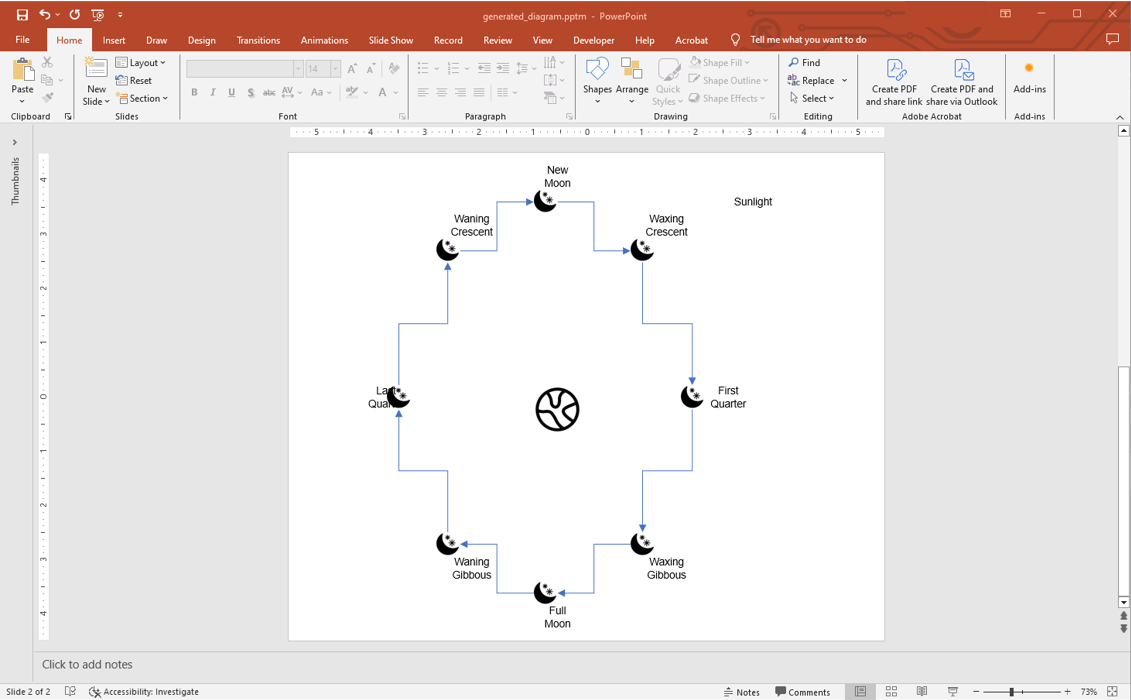
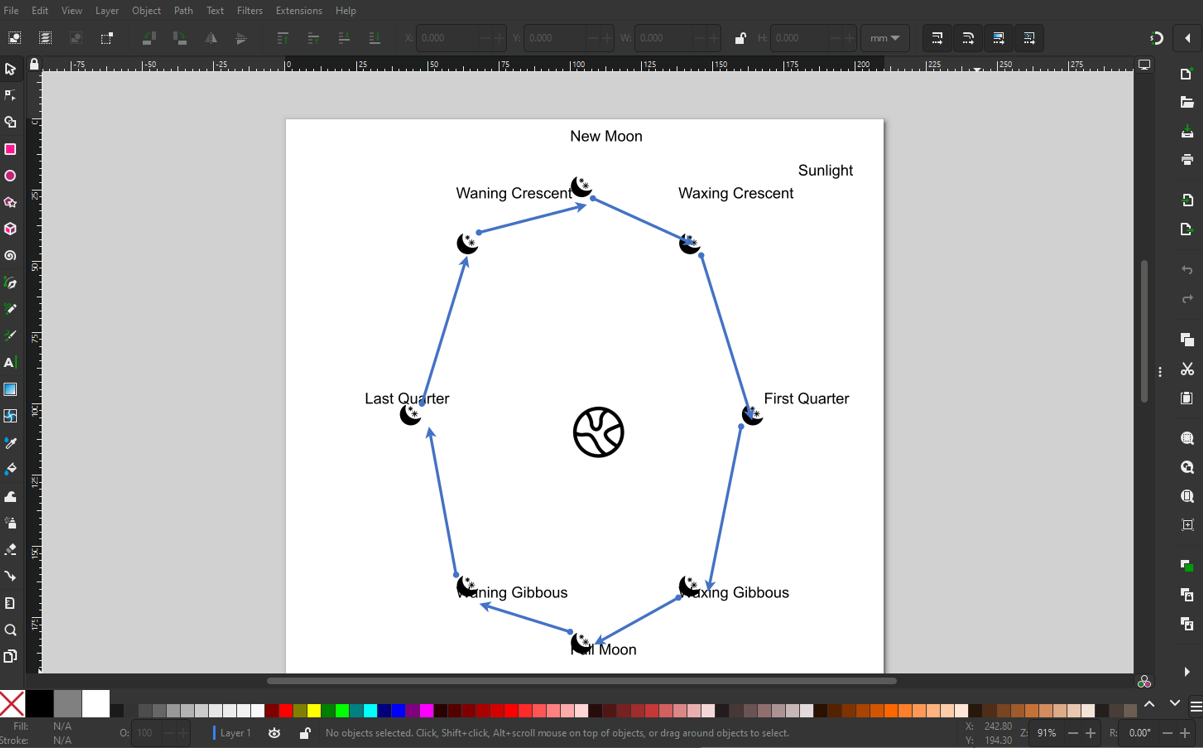
Input Prompt Rendered with Microsoft PowerPoint Rendered with Inkscape
A diagram showing two food chains. The left food chain, starting from the bottom, goes from lichen, to slug, to toad, to snake, to eagle. The right food chain, starting from the bottom, goes from algae, to snail, to crayfish, to fish, to alligator.
A diagram showing the eight phases of the moon with labels as it revolves around Earth. It also indicates the direction of the sunlight.

Citation

If you find our project useful in your research, please cite the following paper:

@article{Zala2023DiagrammerGPT,
        author = {Abhay Zala and Han Lin and Jaemin Cho and Mohit Bansal},
        title = {DiagrammerGPT: Generating Open-Domain, Open-Platform Diagrams via LLM Planning},
        year = {2023},
}