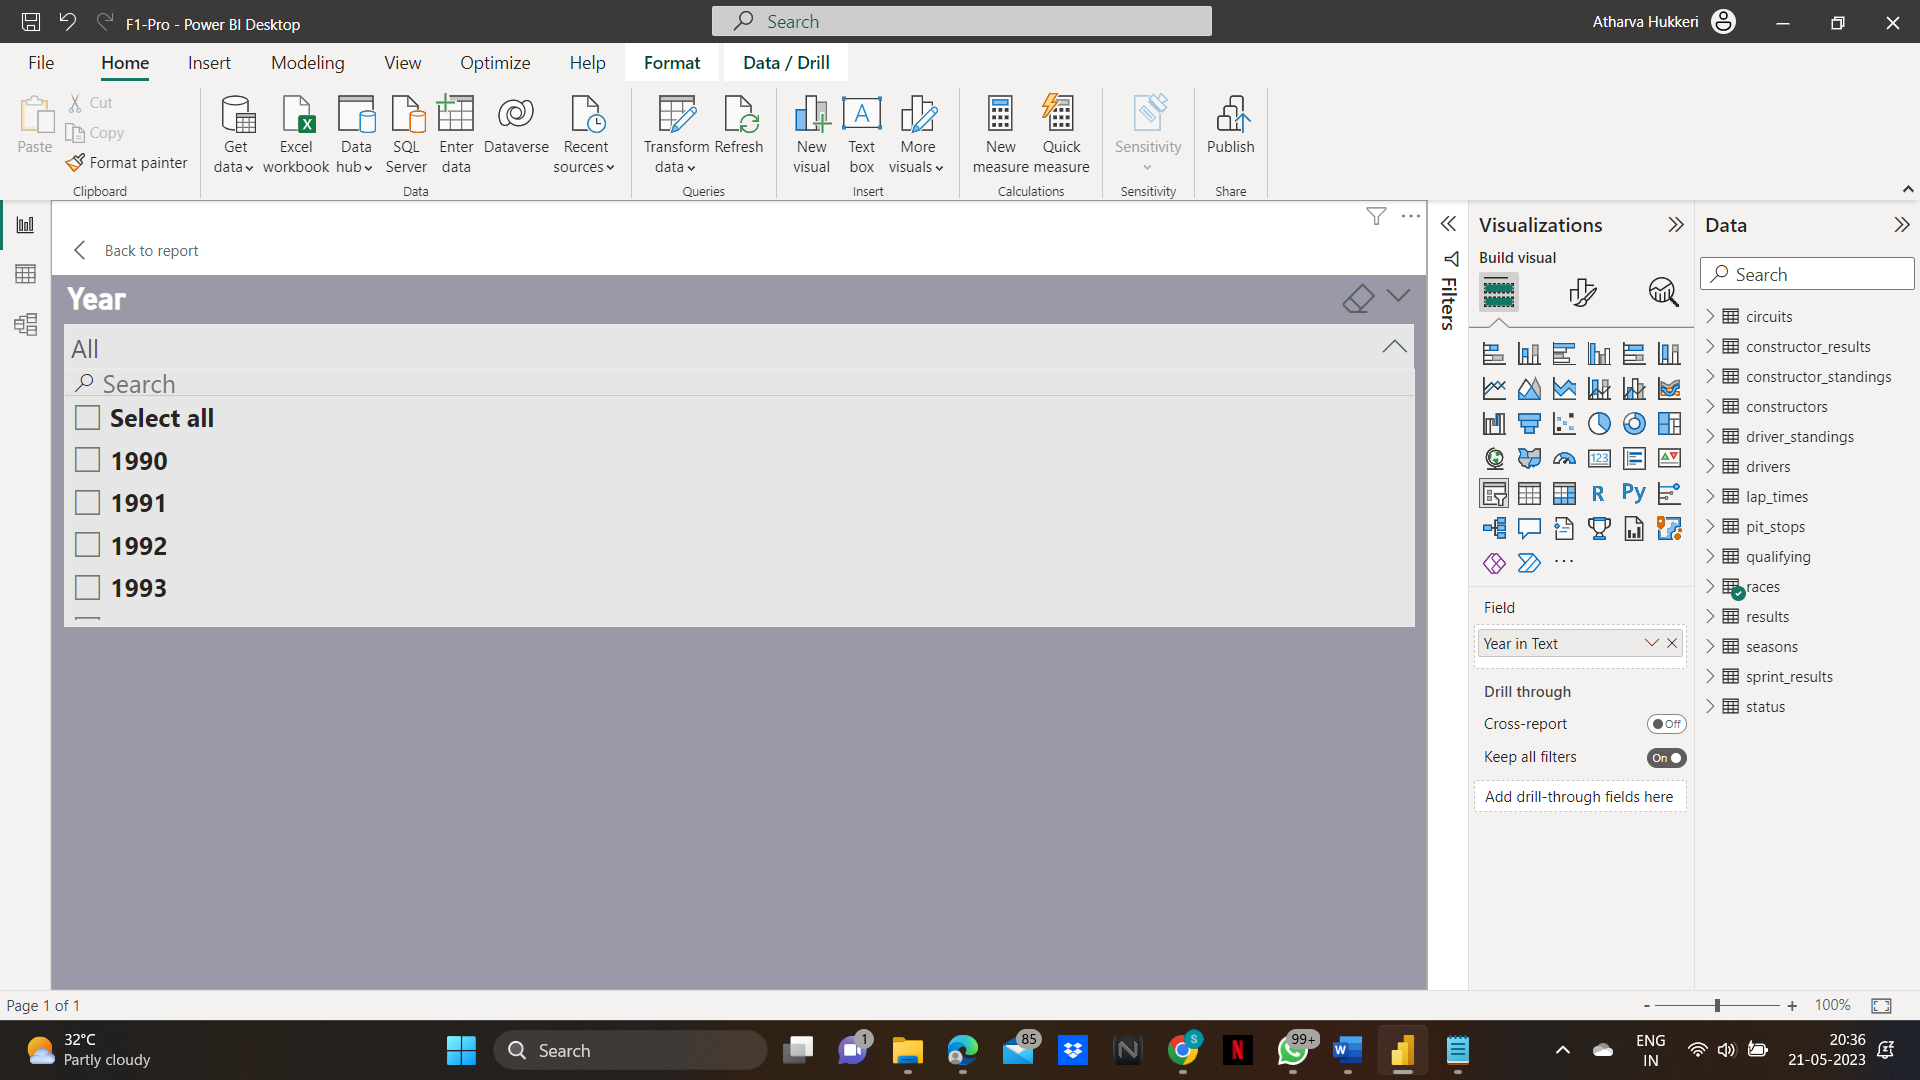
Formula 1 teams need an economic solution to automate their data analysis. It is impossible for teams to manually sift through 500GB of data in time to prepare for the next race. Therefore, teams that attempt to do so are forced to make decisions without knowing crucial information that was lost in the data. To address the needs of handling data volume and a timely analysis, an automated, visual data dashboard should be used by these teams. The objective of this project will be to research and analyse the performance of drivers and their teams through visual dashboard.
📌Microsoft PowerBI
Dataset used if Formula 1 World Championship (1950-2023). The dataset consists of all information on the Formula 1 races, drivers, constructors, qualifying, circuits, lap times, pit stops, championships from 1950 till the latest 2023 season.
Performance Analysis of:
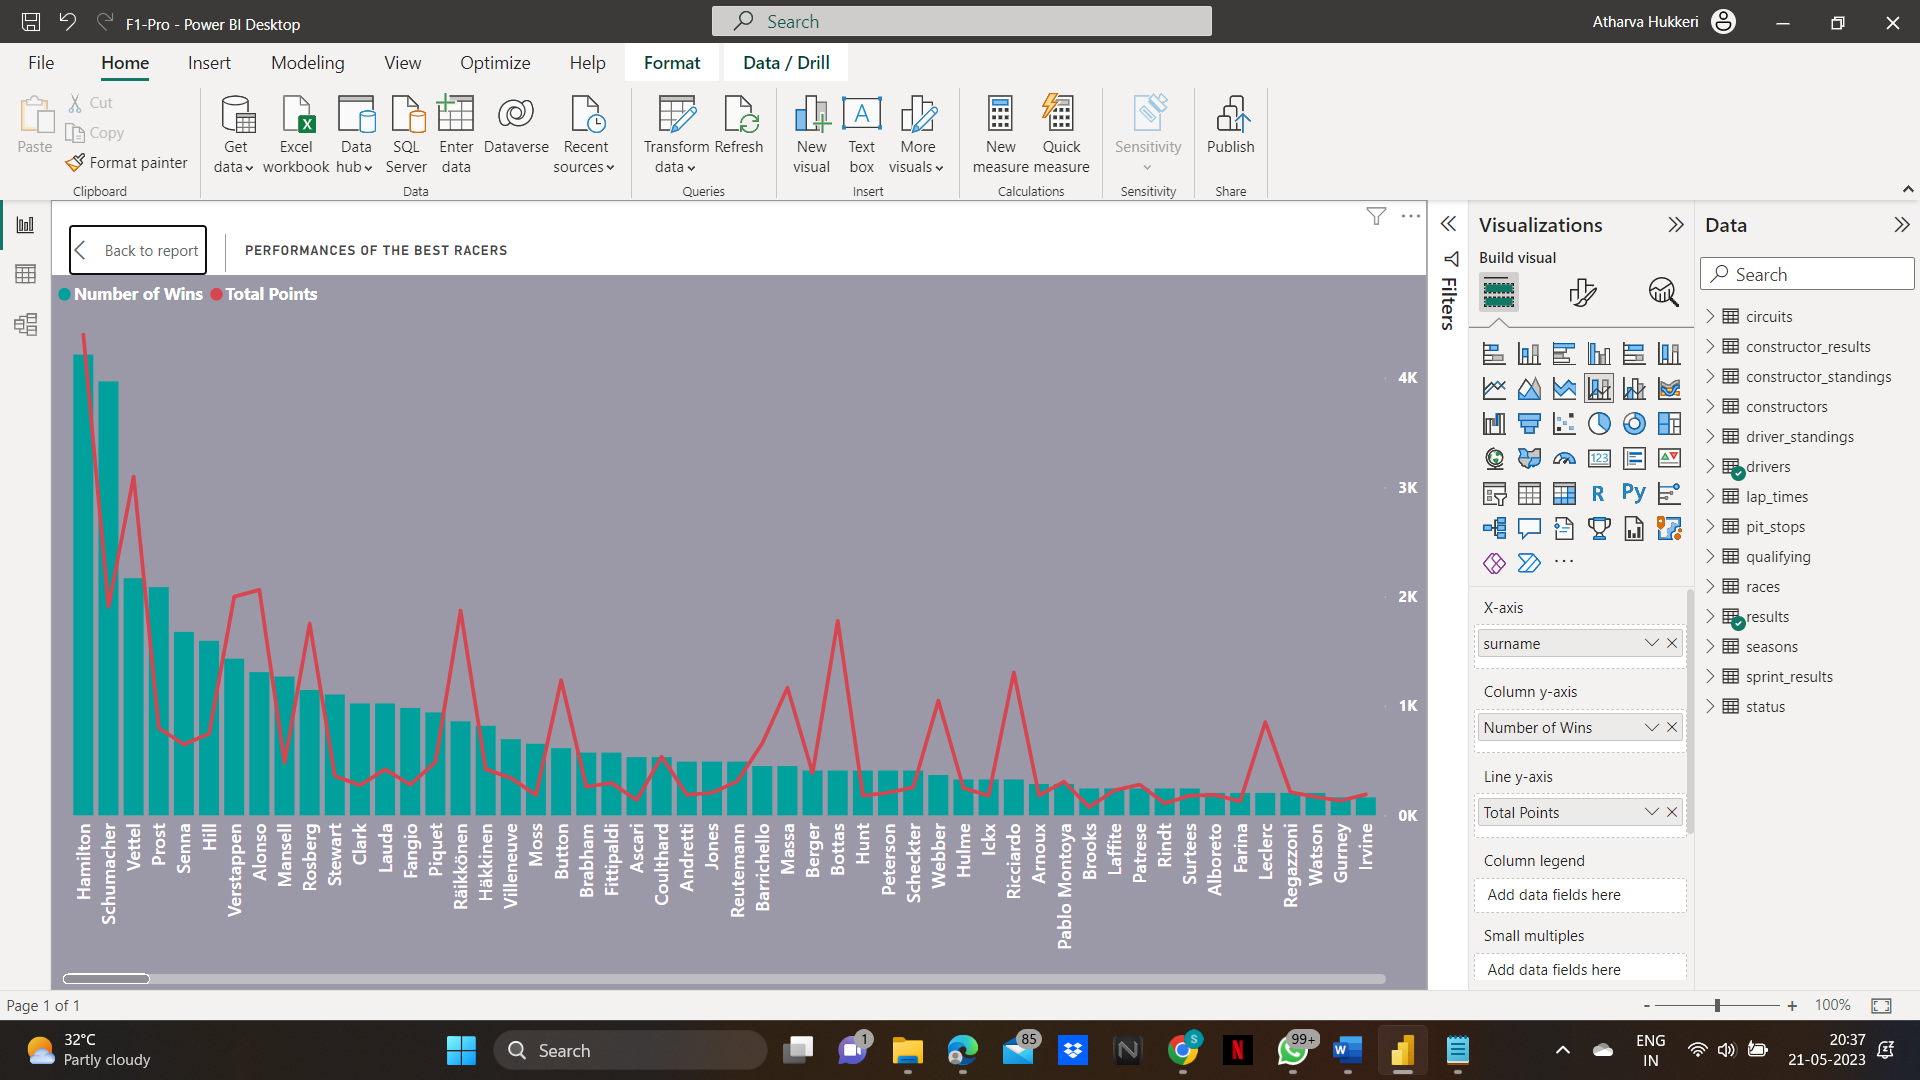
📌The racers best racers.
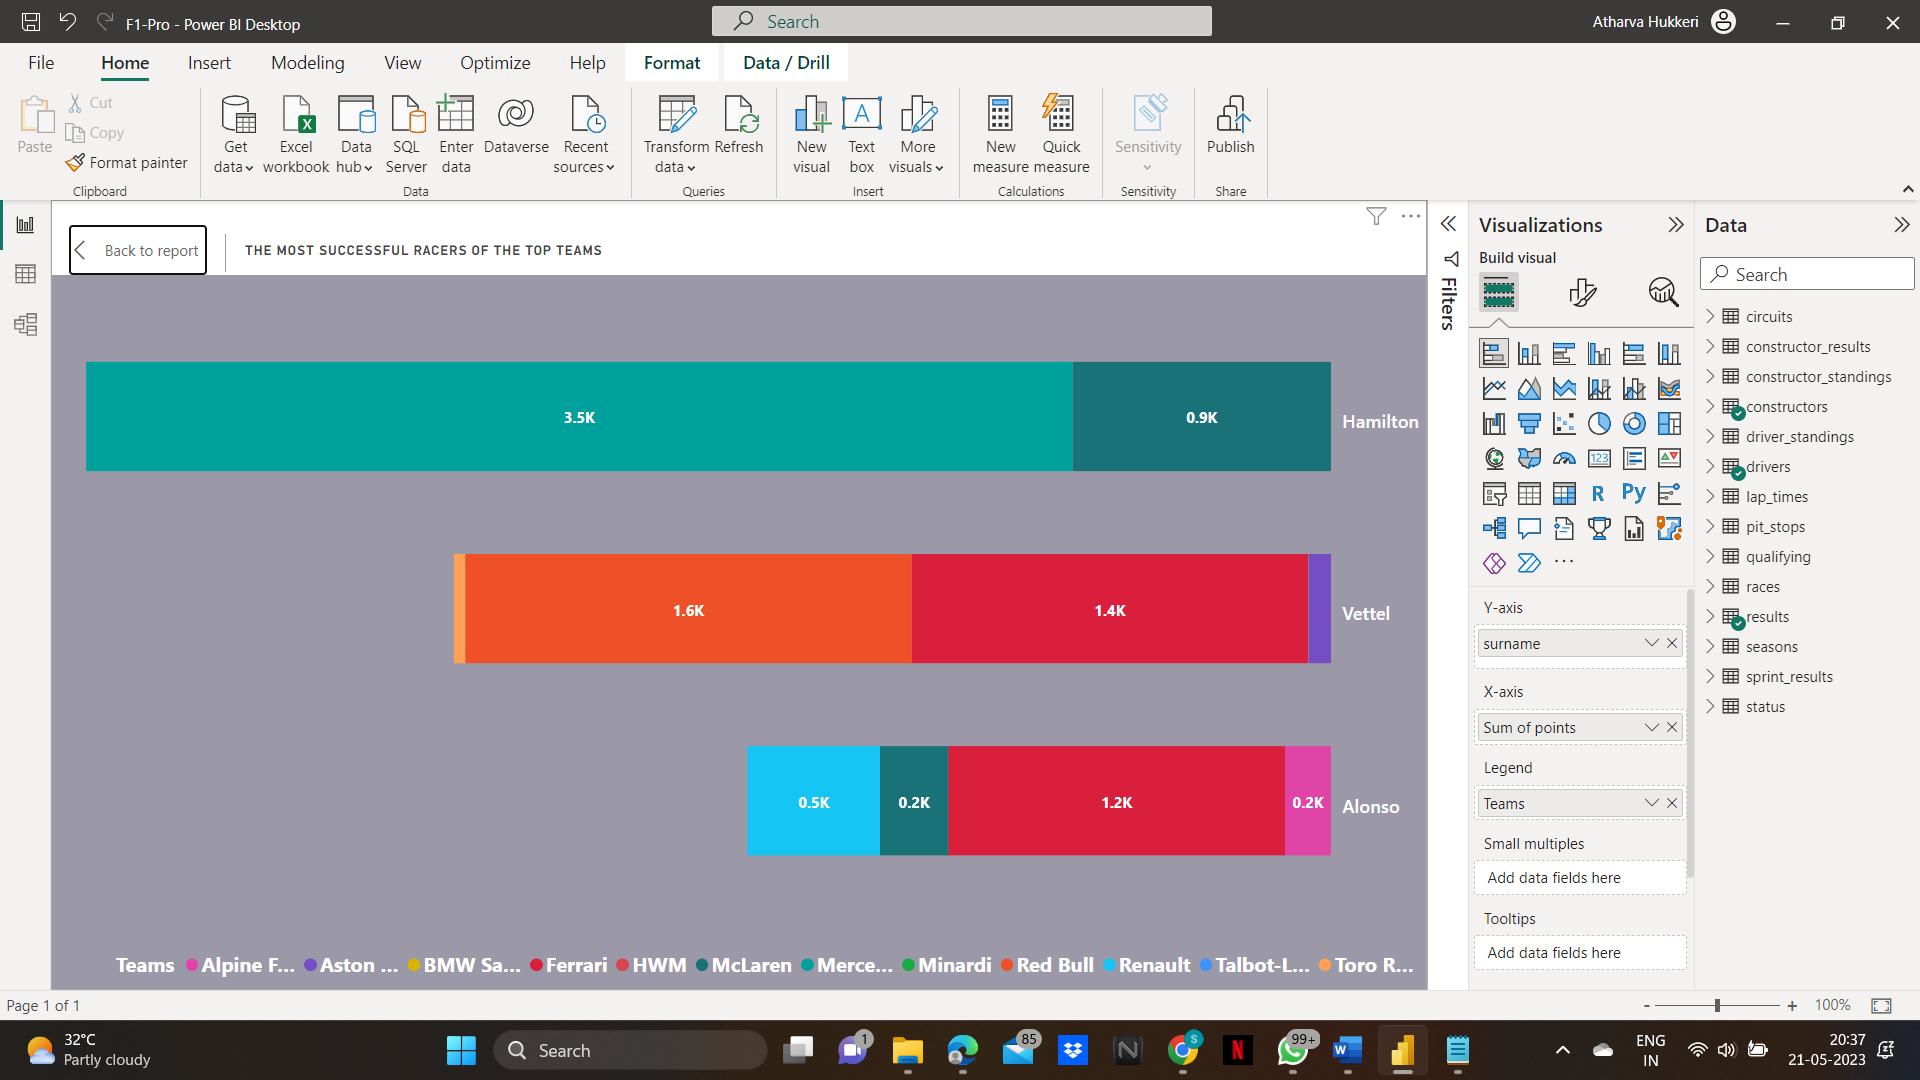
📌Most successful Racer of a of top teams for specific year/all time.
📌Top 3 teams.
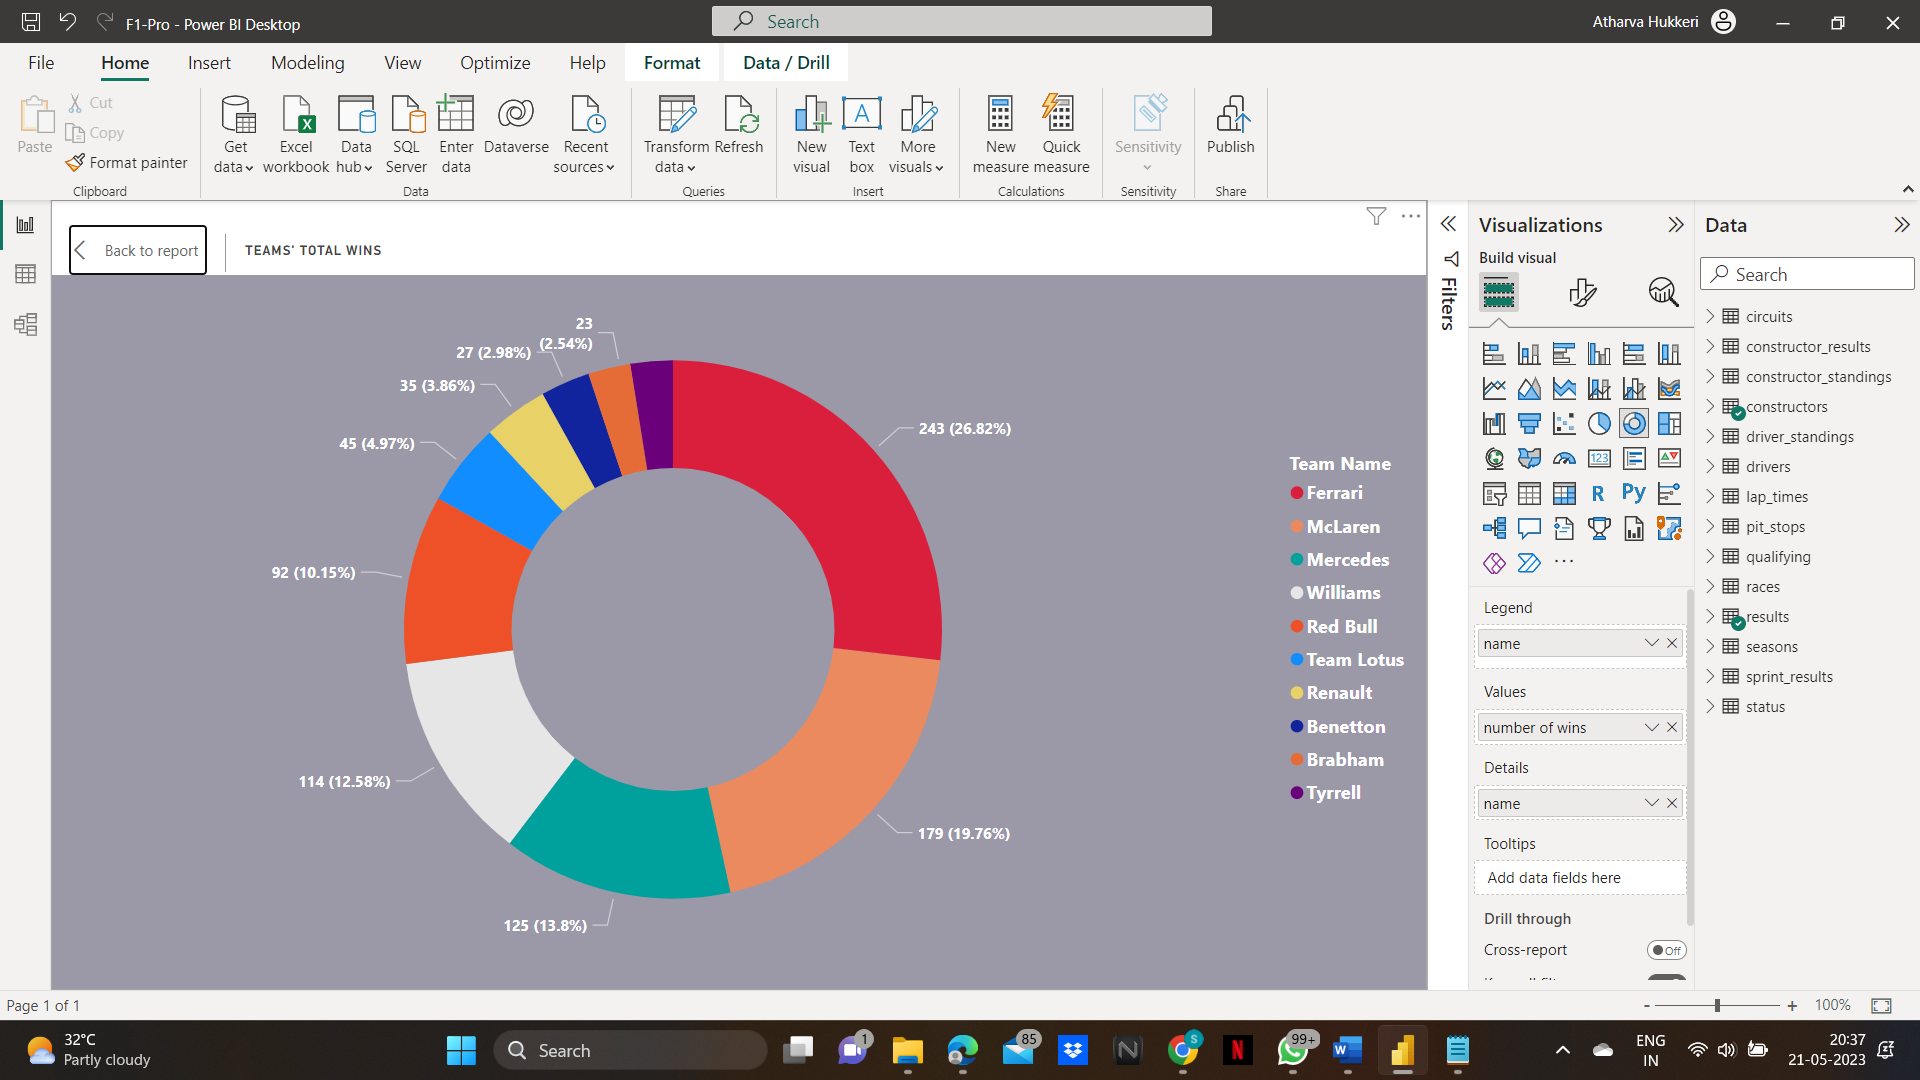
📌Total wins by specific team.


