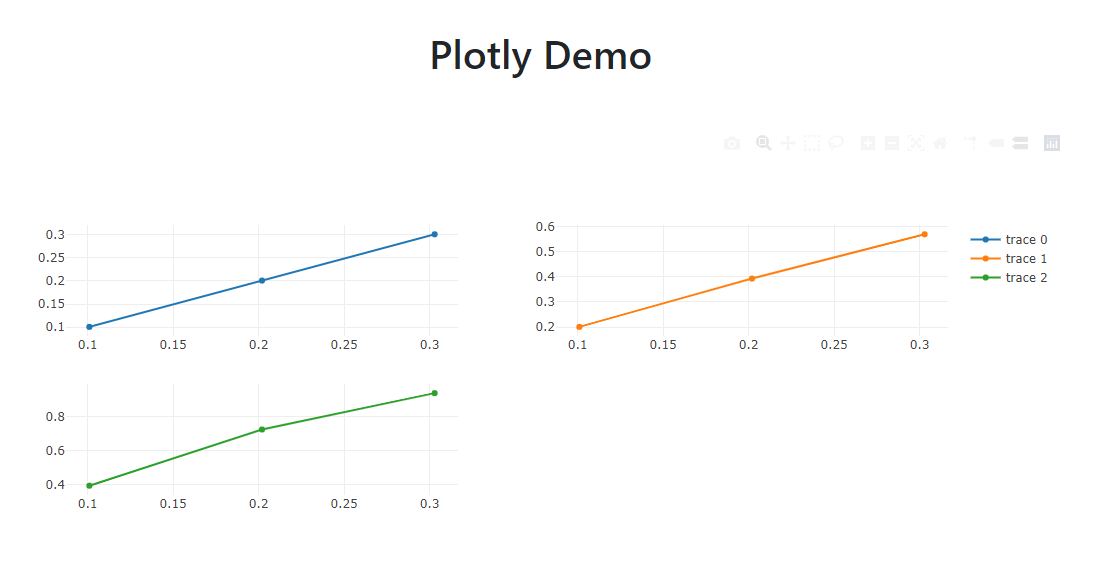
- This Project is built with Docker, Laravel & Vuejs (with BootStrap) to visualize csv by Plotly subplots with shared axes(x-axes here).
docker-compose up -d --builddocker-compose run --rm composer installdocker-compose run --rm npm install- Now create .env file and replace DB_HOST & REDIS_HOST with
DB_HOST=mariadb & REDIS_HOST=redis
OR - Just Rename /src/env.sample as .env file (If you just want to explore project)
docker-compose run --rm artisan migrate
- Development:
docker-compose run --rm npm run watch-poll- OR
docker-compose run --rm npm run dev
- Production:
docker-compose run --rm npm run prod
- Csv file must contain column named "Time". Checkout Sample CSV.
