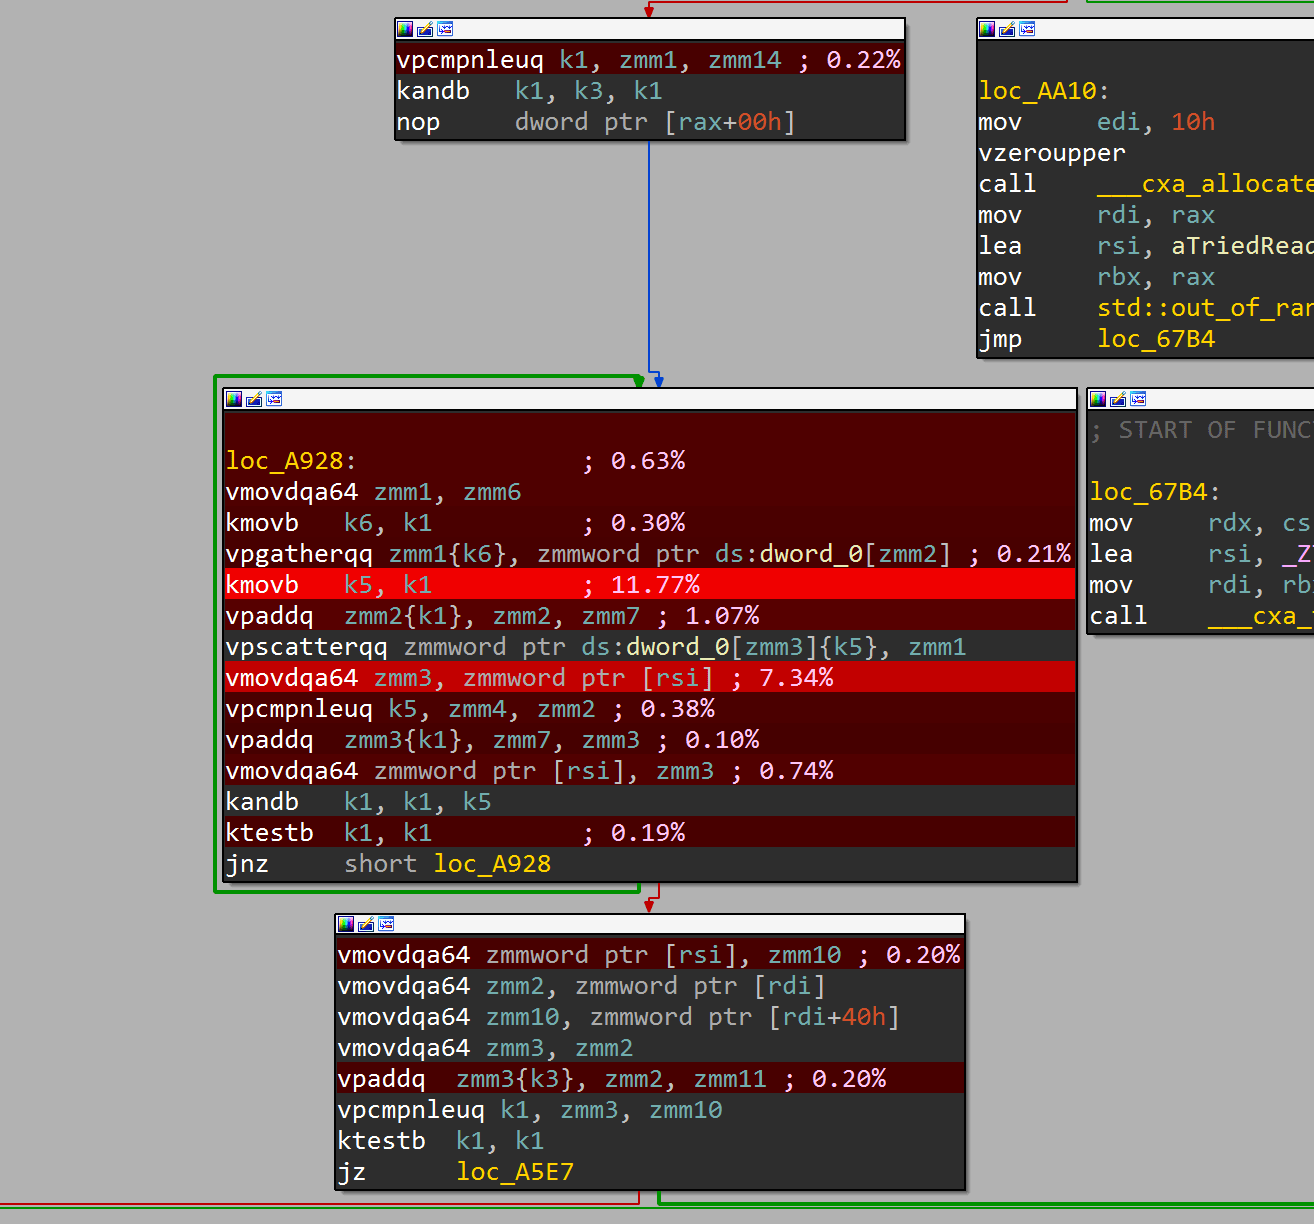
Simple tool for viewing Linux perf traces in IDA Pro.
If you don't have Rust installed yet, you can learn how to do so here. Rust is required to compile the preprocessing util for the perf trace since doing that work in IDA Python would likely have made it impossible to import real world sized traces that tend to be many gigabytes in size.
cargo install --git https://github.com/athre0z/idaperf.gitperf record -o ./perf.data -- ./your-app-here
perf script --no-demangle -i ./perf.data -F ip,sym,symoff,dso,event | idaperf your-module-name-here > dump.csvThe your-module-name-here string doesn't have to be the whole module name,
it is sufficient to provide a substring that uniquely filters for symbols
in your module.
After that, you can import the reduced dump into IDA as follows:
- Load your module into IDA
File -> Script file- Select the
idapy-import-perf-data.pyfrom this repo - Select the
dump.csvyou previously created - Done!
