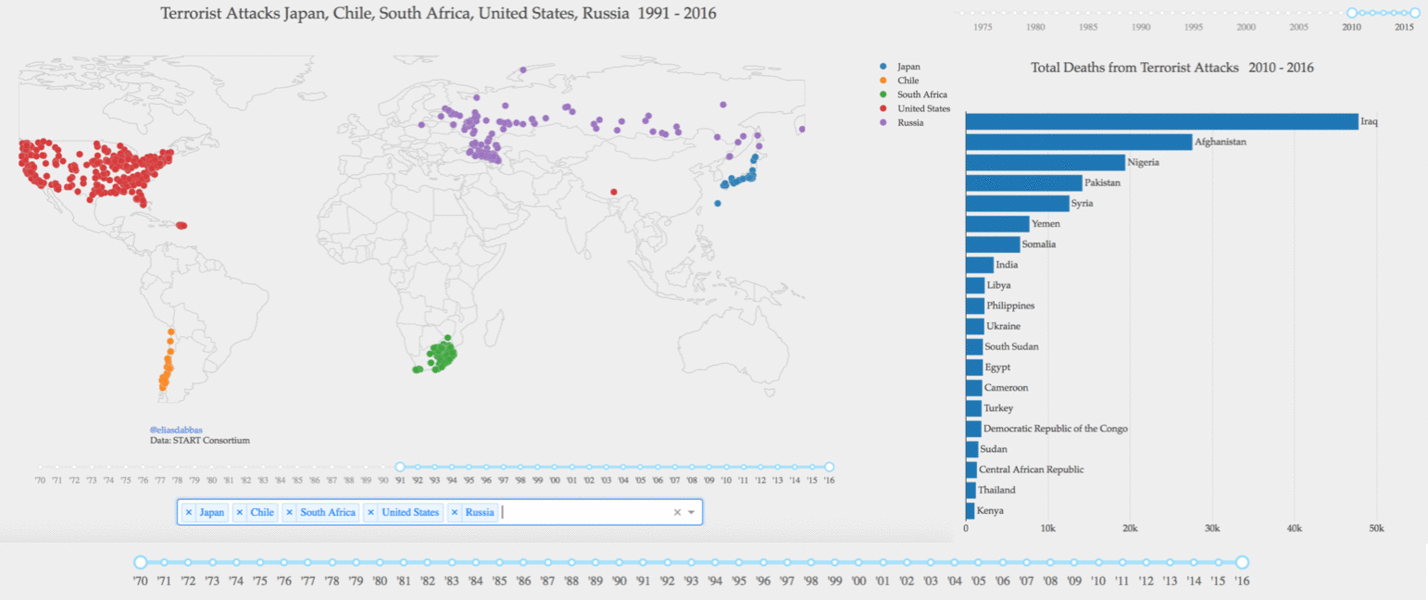
Global Terrorism Database Interactive Dashboard
Explore the live dashboard here.
Overview
This interactive dashboard provides a comprehensive visualization of the Global Terrorism Database. The dataset is sourced from the National Consortium for the Study of Terrorism and Responses to Terrorism (START), and it offers valuable insights into global terrorism trends.
Technologies Used
- Programming Language: Python
- Packages:
- Plotly: Charts and data visualization
- Plotly's Dash: Interactivity
- Pandas: Data frame handling and processing
- Heroku: Hosting / app management
Data Source
The dataset is obtained from the Global Terrorism Database, provided by the National Consortium for the Study of Terrorism and Responses to Terrorism (START). It contains a wealth of information about terrorist incidents worldwide.
For more details and to access the dataset, visit this link.
Note: The dashboard is hosted on Heroku, offering a seamless user experience.
Enjoy exploring the data and gaining valuable insights into global terrorism trends using this interactive dashboard!
