This project focused on the application of Python web scraping methodologies and how we leveraged their useful functions for performing data analytics and visualization as part of the Extract, Transform, and Load (ETL) process.
This project and Module 11 assignment focused on honing our knowledge and skills of web scraping and data analysis through some rigorous exercises for further understanding the concepts of Extract, Transform, and Load process, which included effective prototyping of data transformation, efficient iterative process, engineering, and analysis of data collected via web scraping. We leveraged some useful Python libraries, Splinter, Selenium, Chrome DevTools and many of its integrated useful modules, functions, and data structures when accomplishing the Extract and Transform phases of the ETL process more efficiently. We have learned how to scrape various type of information, including identifying HTML elements on a page, identifying their id, class, and other attributes, and using this knowledge to extract information via both automated browsing with Splinter and HTML parsing with Beautiful Soup. These included HTML tables and recurring elements, like multiple news articles on a webpage. We then applied our knowledge and core skills to collecting data, organizing and storing data, analyzing data, and visually delivering some insights of the datasets.
- Website: Mars News, Mars Temperature Data
- Source code: mars_data_challenge_part_1.ipynb, mars_data_challenge_part_2.ipynb, mars_news.ipynb
- Output file: mars_data.json, mars_data_method1.json, mars_data.csv
- Image file: png files
- Software: Splinter, webdriver-manager, Beautiful Soup, Chrome DevTools, conda, Python 3.9, or their newer releases.
Our goal was to familiarize ourselves with web scraping, prototyping, modeling, engineering, and exploring the scraped data, which could be applied for uncovering various data facts about the "Red Planet" Mars. Our analysis and visualization required us to scrape certain parts, attributes, and data from two websites relevant to Mars exploration and Mars climate database. We summarized our in-depth data analytics and visualizations of the scraped data, which included bar plots, polar plots, and scatter/line plots. Outline of our deliverables and a written report for presenting our results and analysis summary:
- ☑️ Deliverable 1: Scrape titles and preview texts from Mars news articles. Optionally export the data into a JSON file or a MongoDB database.
- ☑️ Deliverable 2: Scrape and analyze Mars weather data, which exists in a table.
- ☑️ Summary: A written report for the data analytics and visualizations (this "README.md").
All deliverables in Module 11 challenge are committed in this GitHub repo as outlined below.
main branch
|→ ./README.md
|→ ./mars_data_challenge_part_1.ipynb
|→ ./mars_data_challenge_part_2.ipynb
|→ ./mars_news.ipynb
|→ ./Data/
|→ ./Data/mars_data.json
|→ ./Data/mars_data_method1.json
|→ ./Data/mars_data.csv
|→ ./Data/mars_mintemp.png
|→ ./Data/mars_pressure.png
|→ ./Data/mars_elapsedsol.png
|→ ./Data/mars_solarlongitude.png
|→ ./Data/mars_mintemp_daily.png
By using several Python libraries/modules, including Pandas, Splinter, Selenium, Chrome DevTools, Beautiful Soup, and Matplotlib, to extract and transform Mars news and climate databases, we were able to explore the climate trends, estimate the Martian seasons and year, and deliver the required visualizations. We also created Matplotlib plots to enable better visualization of the analysis results that let us conduct some in-depth observations and draw more accurate conclusions. I have also adopted some recent techniques and improved approaches that better served our analysis and visualization purposes.
The corresponding Jupyter Notebook source code and output JSON file can be referred in mars_data_challenge_part_1.ipynb, mars_data.json, and mars_data_method1.json. I applied two methods for accomplishing the web scraping of the Mars News. The objective here was to enhance our understanding of more efficient web scraping methodologies. I revealed that both methods worked well for scraping the required information without problems, though I also noticed that Method 2 was more robust than Method 1 in which we were using the deprecated executable_path key for interacting with a website. Method 2 was especially better when switching to another web browser such as MS-Edge Chromium. The code snippet for enabling EdgeChromiumDriverManager from the webdriver_manager can be referred below.
- Method 1 by using splinter's executable_path and Browser.
- Method 2 by using selenium's webdriver.
from selenium import webdriver
# import below when using Chrome browser
from selenium.webdriver.chrome.service import Service
from webdriver_manager.chrome import ChromeDriverManager
# import below when using MS-Edge browser
from selenium.webdriver.edge.service import Service
from webdriver_manager.microsoft import EdgeChromiumDriverManager
I saved the scraped data containing all titles and preview texts from Mars news articles into a file in JSON format by using json.dump() and verified the stored data by using json.load() functions, which could be replicated by using the following code snippets. I also created a MongoDB database at the end of this exercise to ensure everything works as expected.
# Parse the HTML (selenium 4)
html = driver.page_source
news_soup = soup(html, 'html.parser')
slide_elems = news_soup.select('div.list_text')

# Find and store all news article titles and preview texts
news_list = []
for elem in slide_elems:
    # Use the parent element to find the news article title
    title = elem.find('div', class_='content_title').text
    # Use the parent element to find the paragraph text
    preview = elem.find('div', class_='article_teaser_body').text
    # Append each key-value pair to a list/dict
    news_list.append({'title': title, 'preview': preview})
import json
# export the Python list/dict into a JSON file
outfile = './Data/mars_data.json'
with open(outfile, 'w', encoding='utf-8') as f:
    json.dump(news_list, f, ensure_ascii=False, indent=4)

# Verify the json file
infile = open(outfile, 'r', encoding='utf-8')
mars_data = json.load(infile)
mars_data
The Jupyter Notebook source code used for Deliverable 2 can be reviewed in mars_data_challenge_part_2.ipynb. The output csv file is saved as mars_data.csv. We used the following parameters, cited from Mars facts, for delivering Deliverable 2 requirements. One Sol refers to a solar day on Mars, which is also called Mars day or Martian day and 88775.245 seconds (approximately 24.66 hours) long. Terrestrial time (TT) or day refer to an Earth time or day, and one terrestrial day is 86164.0916 seconds (approximately 23.93 hours) long.
- 1 Earth day = 86164.0916 seconds or 23.93 hours.
- 1 Earth year = 365.25 days (days for Earth to orbit the Sun once).
- 1 Martian day = 88775.245 seconds or 24.66 hours.
There were 12 Martian months in the dataset that we scraped, which I verified by running mars_months = np.unique(mars_df['month']).
The coldest and warmest months on Mars were Martian Month of 3 (-83.31°F) and 8 (-68.38°F) as presented in Table 1. The coldest daily min temperature of -90.0°F was recorded on terrestrial_date 2015-12-09, which was a day in Martian Month of 3, however the warmest daily min temperature of -62.0°F was recorded on terrestrial_date 2017-05-10, which was actually a day in Martian Month of 1 instead of 8, the warmest month on average.
Table 1. Coldest and warmest months on Mars
| month | sol | ls | min_temp (°F) | pressure | ls_rad |
|---|---|---|---|---|---|
| 3 | 1204.406250 | 75.010417 | -83.307292 | 877.322917 | 1.309179 |
| 8 | 795.333333 | 224.347518 | -68.382979 | 873.829787 | 3.915603 |
Months with the lowest and highest atmospheric pressure on Mars were Martian Month of 6 (745.05) and 9 (913.31) as presented in Table 2. The lowest daily atmospheric pressure of 727.0 was recorded on terrestrial_date 2018-02-27, which was a day in Martian Month of 5 instead of 6.
Table 2. Months with the lowest and highest atmospheric pressure on Mars
| month | sol | ls | min_temp (°F) | pressure | ls_rad |
|---|---|---|---|---|---|
| 6 | 750.829932 | 164.897959 | -75.299320 | 745.054422 | 2.878012 |
| 9 | 861.186567 | 254.052239 | -69.171642 | 913.305970 | 4.434048 |
The bar charts in Fig. 1, 2, and 3 provided further visualization of the monthly average trends of Mars min temperature, pressure, and elapsed sol, respectively. Depending on the seasons on Mars, the duration of elapsed sols seems to vary significantly from month to month (Fig. 3). Fig. 4 illustrated a simplified polar projection of the Martian solar longitude (Ls) ranges by Martian month. I used a sun emoji as the center of the polar projection. A column named ls_rad that consisted of Ls data in radians was added to the final dataframe and csv file.
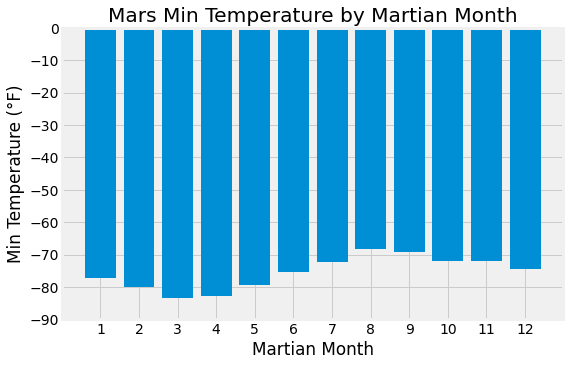
Fig. 1 Mars min temperature by Martian month
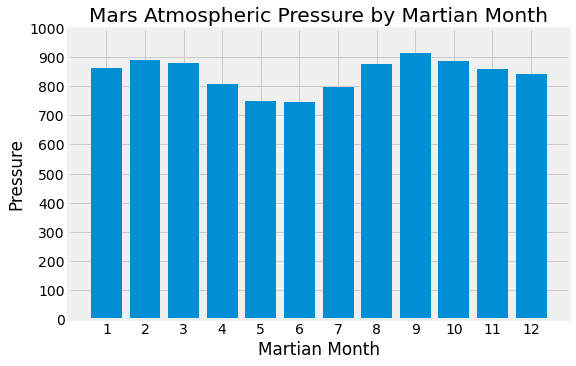
Fig. 2 Mars atmospheric pressure by Martian month
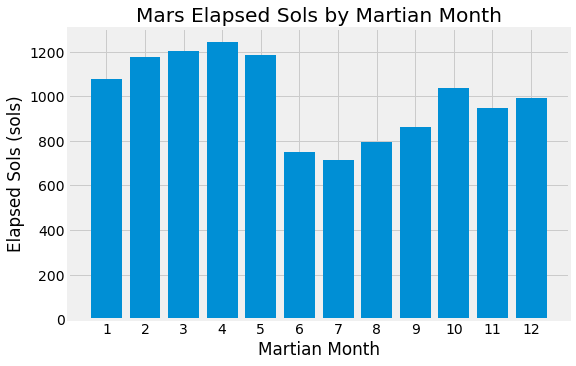
Fig. 3 Mars elapsed sols by Martian month
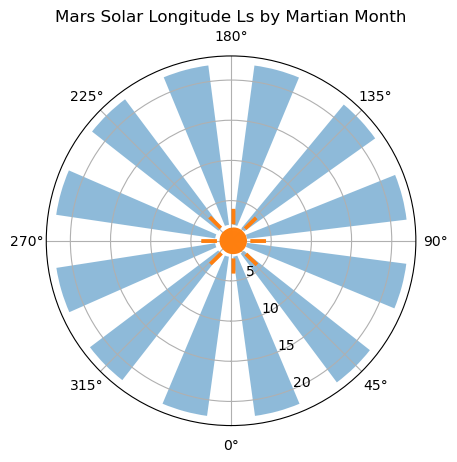
Fig. 4 Mars solar longitude Ls by Martian month
Besides using the visual estimation, I revealed that we could statistically derive the number of Mars sols for Mars to orbit the Sun once by converting the elapsed sol data into monthly sol durations and accumulating the aggregate durations of 12 Martian months. The code snippet that returned an approximation of 675.710 sols (cf. 666.780 sols based on our visual estimation) in a Martian year is shown below. And, by extracting the sol range in the whole dataset using sol_range = mars_df['sol'].max() - mars_df['sol'].min(), we could then get the total orbital periods or Martian years by calculating the sol_range/sols ratio.
# calculate how many sols exist in a Martian year based on monthly elapsed sols
sols = 0
for mm in mars_months:
    sol_duration = mars_df.loc[mars_df['month'] == mm, 'sol'].max() - mars_df.loc[mars_df['month'] == mm, 'sol'].min()
    sols += (sol_duration / 24.66)
# number of Martian days included in the dataset
sol_range = mars_df['sol'].max() - mars_df['sol'].min()
# statistically calculate total orbital periods (= total Martian years)
mars_year = sol_range/sols
The following code snippet outlined how we derived the number of terrestrial days in a Martian year. I estimated there were about 2.9-3.0 orbital periods in the whole dataset by visually observing the total orbital cycles depicted in the 2D-plots that were created by using Martian elapsed sols as x-axis and daily min temperatures as y-axis (Fig. 5). I used the terrestrial day range in the whole dataset and two estimated orbital periods of 2.9 and 3.0 for obtaining an approximation of 685.085 Earth days in a Martian year.
# Visually estimate the result from the daily minimum temperature plots
visual_mars_year = [2.9, 3.0, mars_year]
avg_visual_mars_year = np.mean(visual_mars_year[:2])
avg_mars_year = np.mean(visual_mars_year)
# number of terrestrial days included in the dataset
tday_range = (mars_df['terrestrial_date'].max() - mars_df['terrestrial_date'].min()).days
# Calculate total terrestrial years in the dataset (Mars orbits the Sun once = 1 Martian year)
earth_year = tday_range / 365.25
# estimate how many Earth days exist in a Martian year
visual_sols_to_earthdays = tday_range / avg_visual_mars_year
avg_sols_to_earthdays = tday_range / avg_mars_year
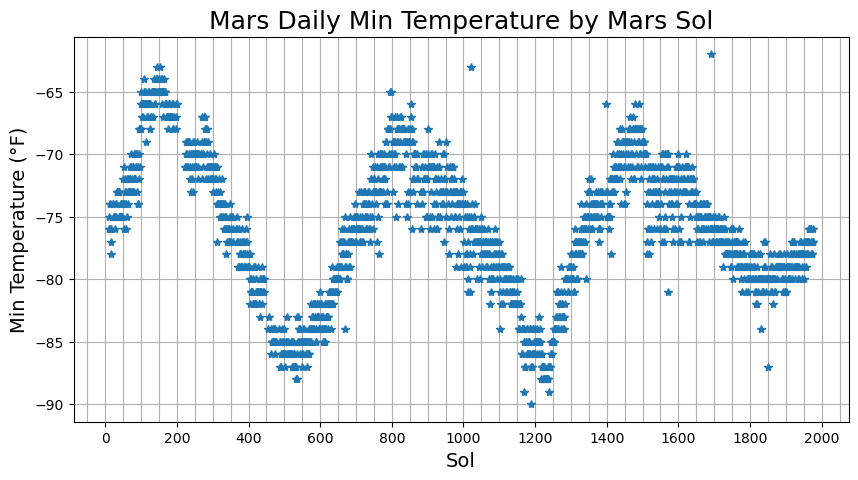
Fig. 5 Mars daily min temperature by Mars sol
All deliverables have been completed and summarized according to Module 11 assignment requirements, including some extra analyses, computations, and visualizations as we have discussed and presented in Deliverable 1 and Deliverable 2 sections. The accuracy of our estimates of how many terrestrial days per Martian year was incredibly high with a negligible ±0.3% deviation from the reported scientific data, as concluded in the numbers below.
- Exact Earth years in the dataset:                   5.533
- Martian years in the dataset (visual estimate):     2.950
- Martian years in the dataset (average estimate):    2.937
- Mars year to Earth year ratio (visual estimate):    1.876 (-0.231%)
- Mars year to Earth year ratio (average estimate):   1.884 ( 0.211%)
- Earth days in a Martian year (visual estimate):   685.085 (-0.279%)
- Earth days in a Martian year (average estimate):  688.116 ( 0.162%)
Pandas User Guide
json - JSON encoder and decoder
Python - datetime date objects
Differences between Flatten() and Ravel() Numpy Functions
executable_path has been deprecated selenium python
About Curiosity Rover
How long is a day on Earth
Martian Seasons and Solar Longitude
Martian Calendars
Matplotlib - Plot types
Unicode Full Emoji List